🌍 Public
D3 v6 Timeline
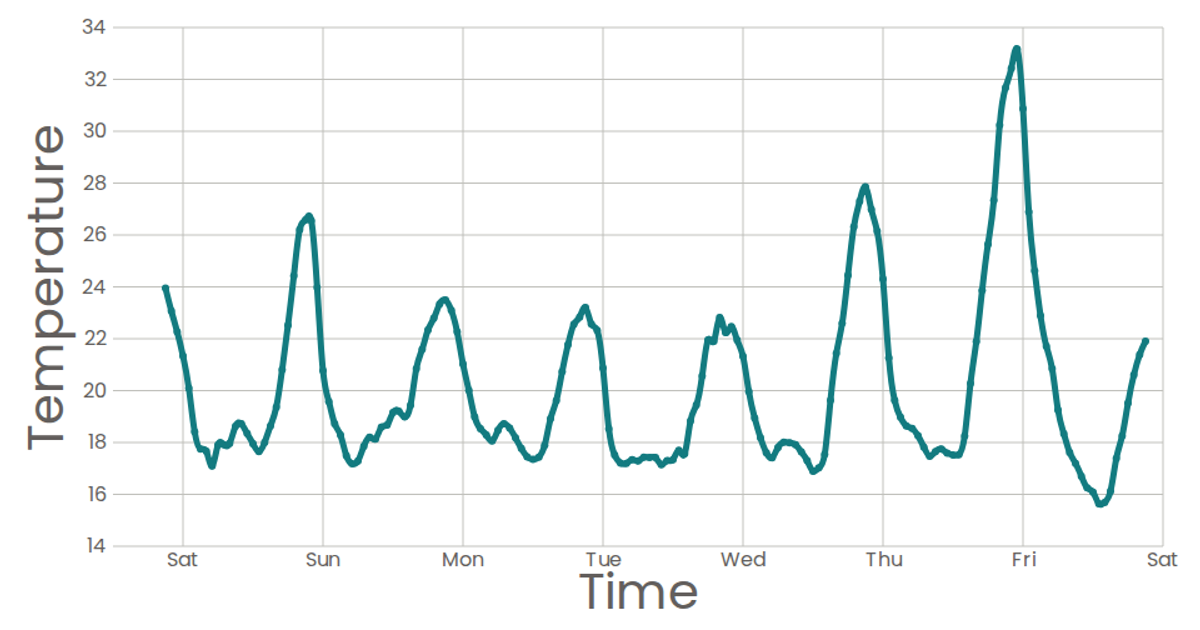
This example plots a line chart of temperature readings across five labeled states using Chart.js, with a time-based x-axis and a y-axis fixed between 0 and 30. The chart renders to a canvas element via the Chart constructor, pulling data from an inline dataset. The page integrates D3 v6 for potential data manipulation and Chart.js for the visualization.
AI-generated descriptionMIT Licensed





Comments
Sign in to join the discussion.