🌍 Public
Assignment2-Pie chart
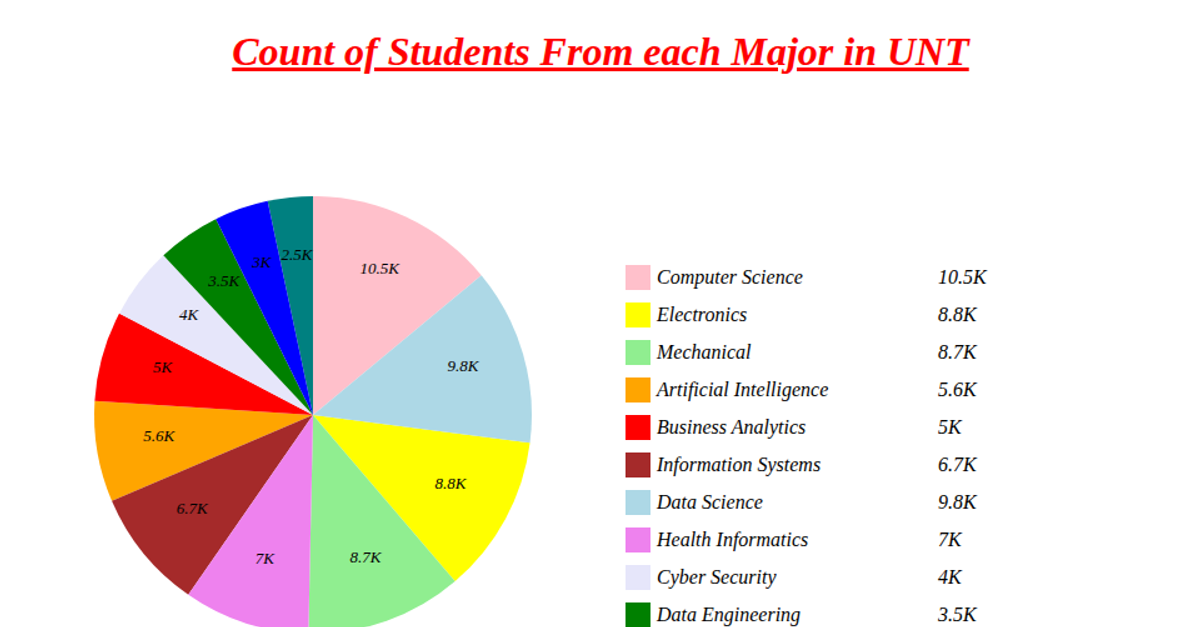
This pie chart displays the distribution of student counts across different majors at UNT, with each slice labeled with its numeric value and accompanied by a color-coded legend. The visualization uses D3 v5 APIs including `d3.pie`, `d3.arc`, and `d3.scaleOrdinal` to compute arc geometry and assign categorical colors, while rendering SVG paths and text elements. Data is fetched as CSV from a GitHub gist, and the chart positions its pie at (250,250) with a legend offset to the right, formatting values in thousands (e.g., "5K").
AI-generated descriptionMIT Licensed






Comments
Sign in to join the discussion.