🌍 Public
ICE 7 Q2-2
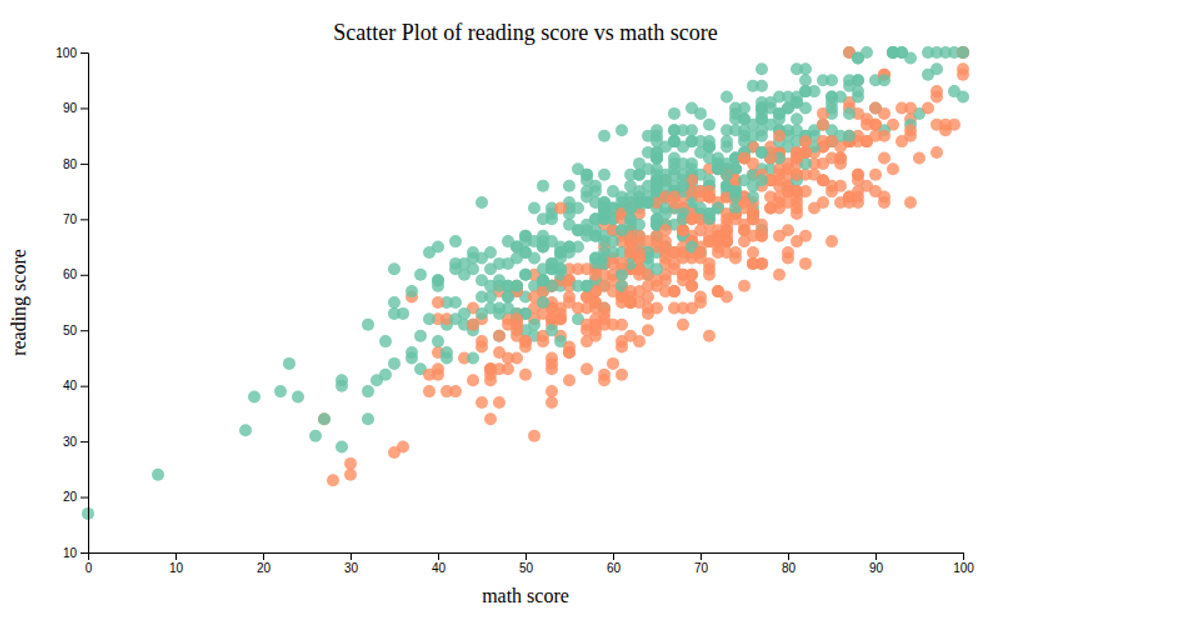
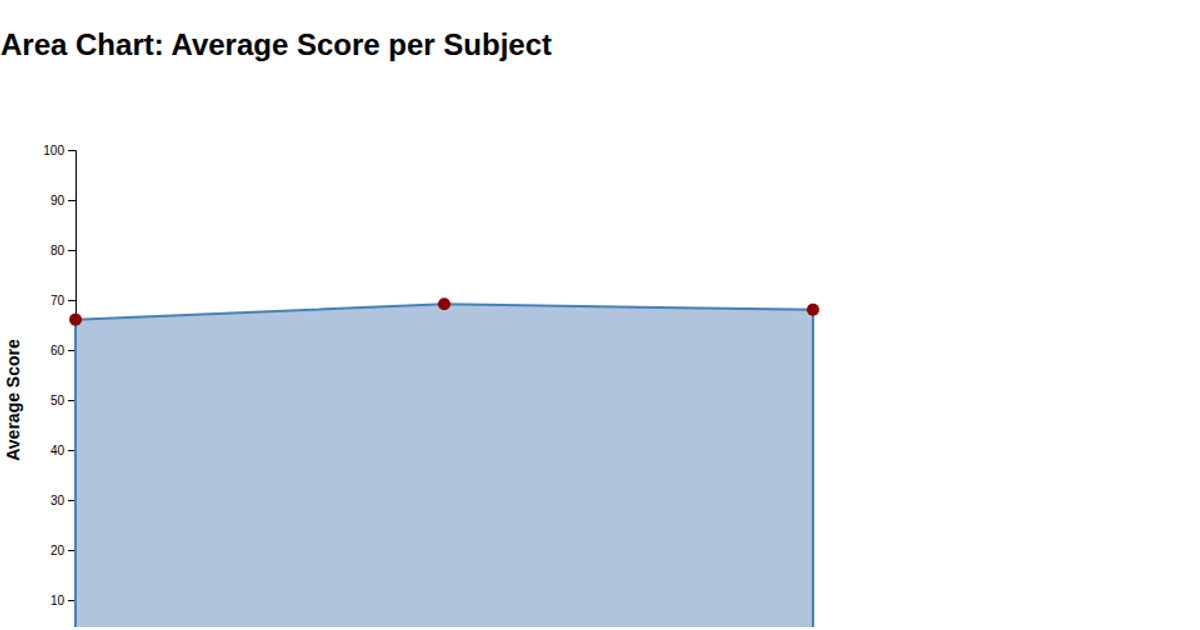
This visualization displays the relationship between students' math scores and their average reading scores. A monotone cubic interpolation curve shows the trend, with a subset of data points highlighted. The code loads a CSV dataset, groups records by math score using `d3.rollups`, and computes the mean reading score for each group. Axes, labels, and the title are rendered using `d3.axisBottom`, `d3.axisLeft`, and SVG `text` elements, with scales defined by `d3.scaleLinear`.
AI-generated descriptionMIT Licensed





Comments
Sign in to join the discussion.