🌍 Public
01_covid19_flag_20210203
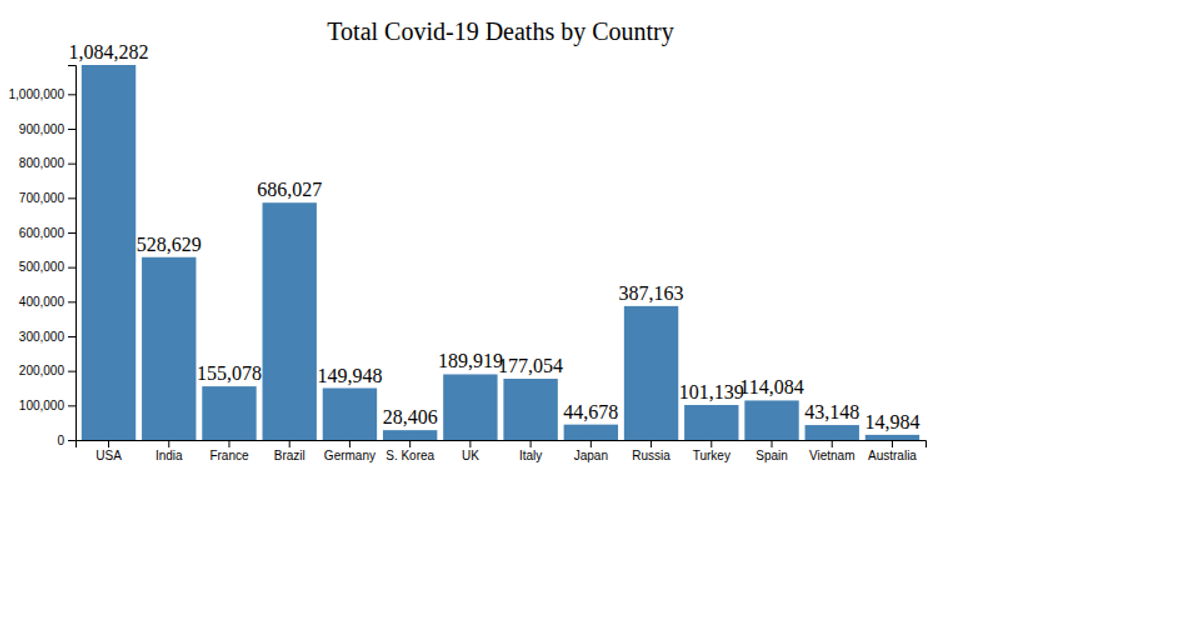
A horizontal bar chart displays the seven-day average of COVID-19 deaths per Brazilian state, sorted in descending order. The chart uses d3.scaleLinear for the x-axis, d3.scaleBand for the categorical y-axis, and renders SVG rectangles. Data comes from a local CSV file parsed with d3.csv, with axes styled using d3.axisLeft and d3.axisBottom.
AI-generated descriptionMIT Licensed




Comments
Sign in to join the discussion.