🌍 Public
Vega-Lite API Template
CCurran Kelleher
Last edited Sep 10, 2019
Created on Sep 10, 2019
Forked from Massachusetts City Population by Burglary
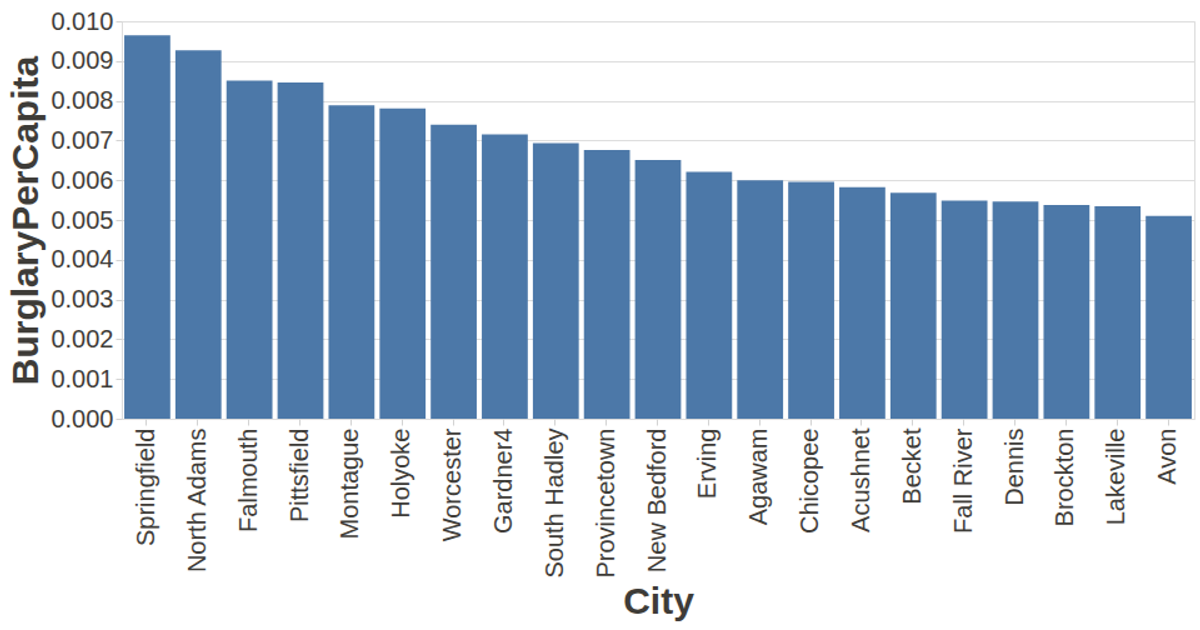
This visualization shows the burglary rate per capita for Massachusetts cities, filtering to only those with rates above 0.005 and sorting the bars from highest to lowest. The bars are rendered with the Vega-Lite API, which builds a specification that Vega then renders as scalable vector graphics. Data is loaded from a CSV file using `d3.csv` and processed to calculate the per-capita metric. Interactive tooltips display the city name when hovering, and the chart automatically fits the browser window dimensions.
AI-generated descriptionA visualization constructed using the vega-lite-api.
MIT Licensed


Comments
Sign in to join the discussion.