🌍 Public
BHAVANI MANDULA TASK 9
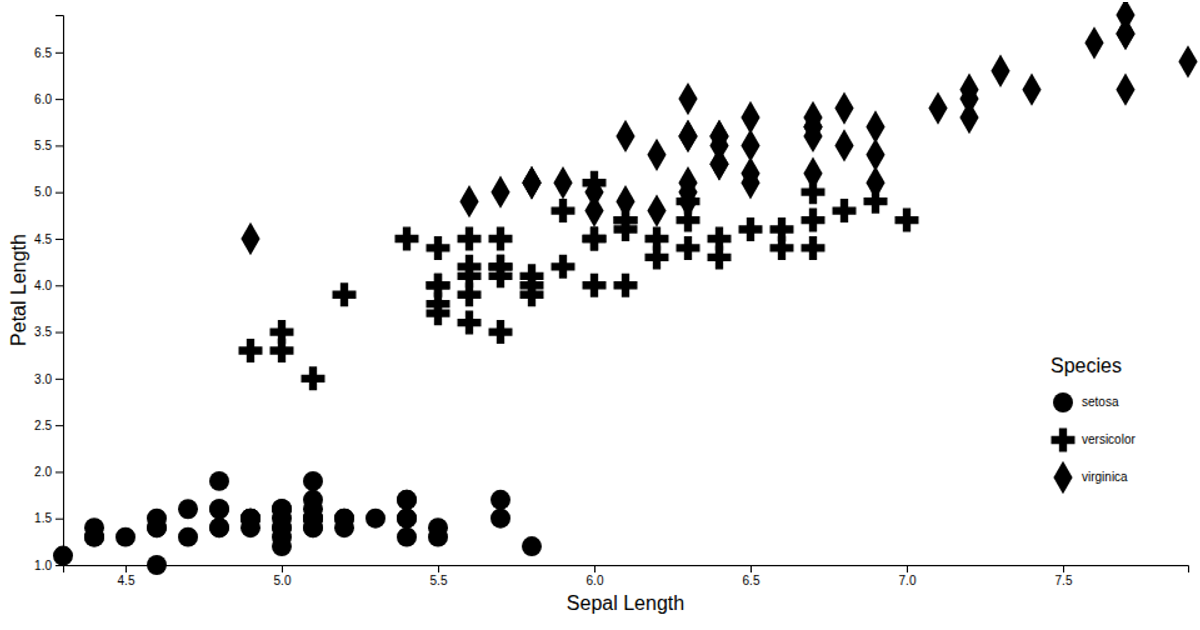
This visualization displays an Iris dataset’s sepal length as a pie chart, using D3.js to transform CSV data into proportional arc segments. Each slice’s color corresponds to a species, with a legend mapping colors to species names. The code uses `d3.csv` to load the dataset, `d3.pie` and `d3.arc` for chart geometry, and `d3.scaleOrdinal` with `d3.schemeCategory10` for categorical coloring. SVG rendering creates the pie chart, while HTML divs form the legend.
AI-generated descriptionMIT Licensed




Comments
Sign in to join the discussion.