🌍 Public
Fork of Fork of Let's make a Bar Graph with D3.js
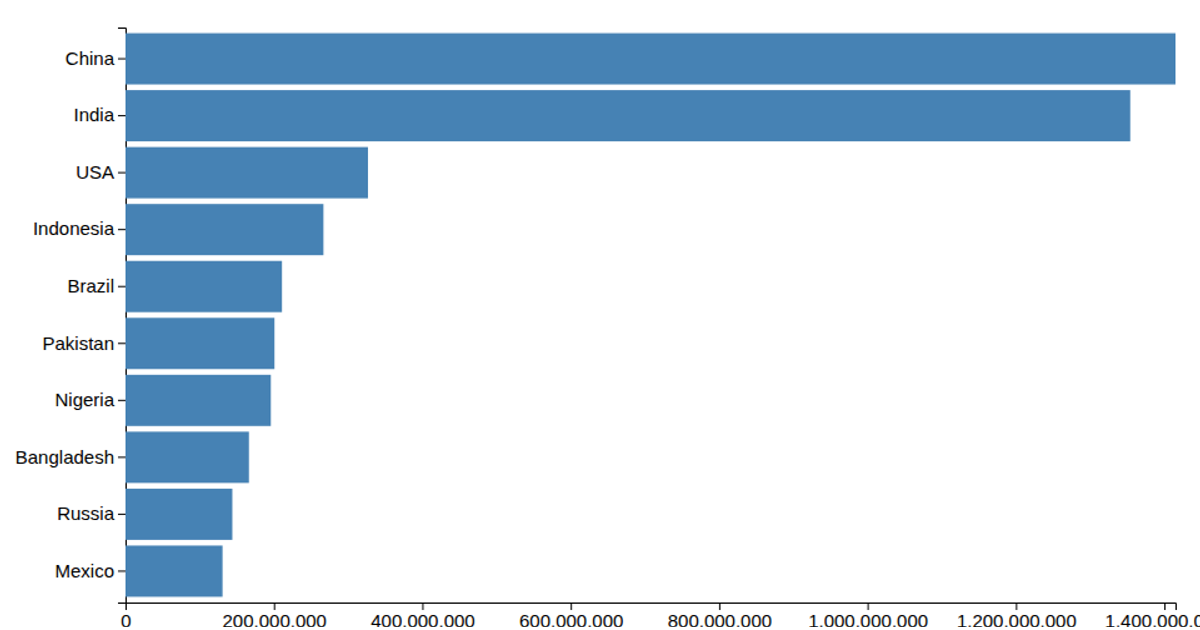
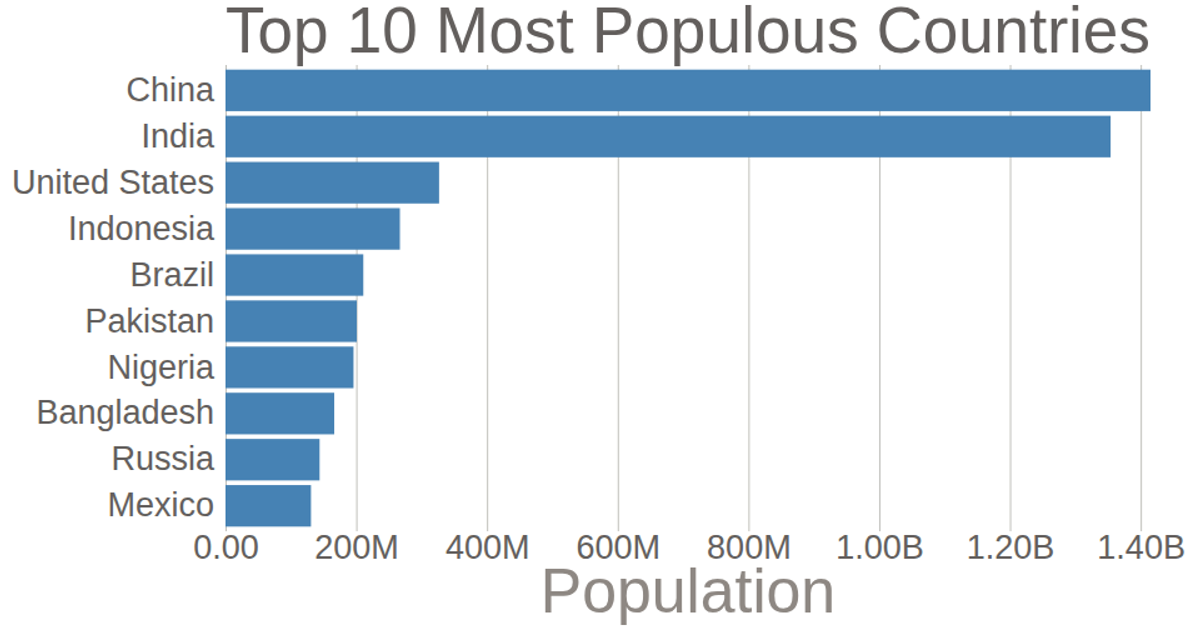
A horizontal bar chart ranks countries by economic value, with China leading and France trailing. Bars are rendered as SVG rectangles using D3 v7’s `scaleBand` for y-axis positioning and `scaleLinear` for widths, with `axisLeft` and `axisBottom` generating axes. The chart includes hover tooltips via `d3.select` transitions and a CSV-loaded dataset, animated only through opacity changes on mouseover.
AI-generated descriptionMIT Licensed



Comments
Sign in to join the discussion.