🌍 Public
The Problem of Occlusion
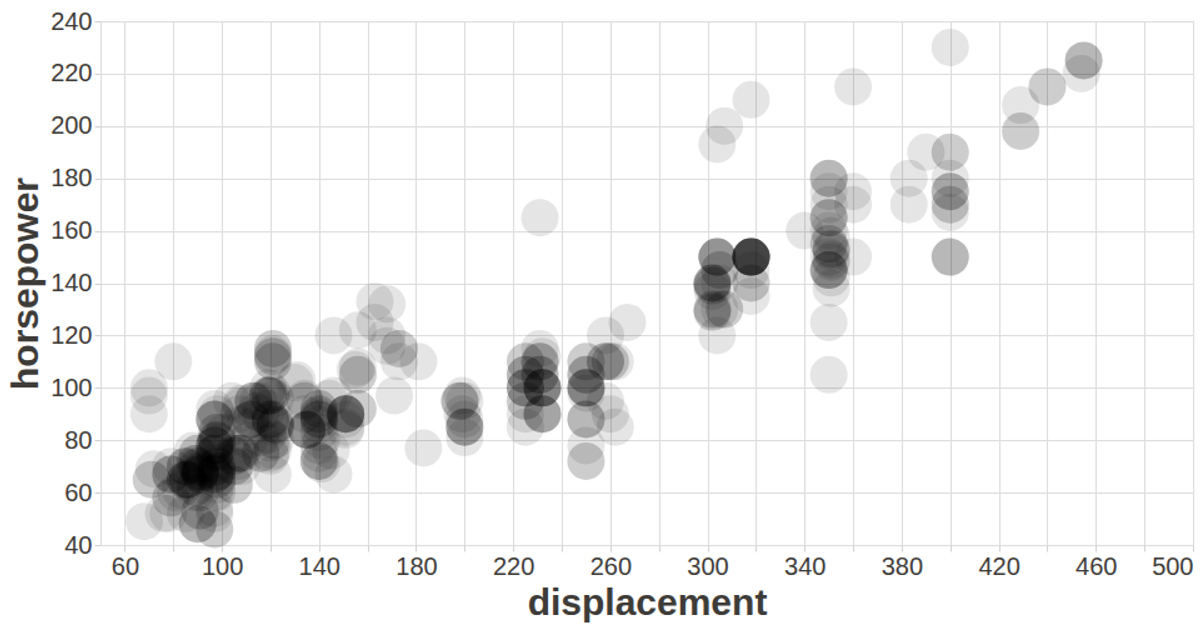
This example illustrates the problem of occlusion in scatter plots, where overlapping points hide underlying data. The visualization plots automobile displacement against horsepower using data from a CSV file fetched via `d3.csv`, with tooltips displaying vehicle names. Built with the `vega-lite-api`, it renders points as filled, opaque circles, and the dense clustering reveals how marks obscure one another. The code customizes axes and labels through a Vega-Lite config object to improve readability under the heavy overlap.
AI-generated descriptionA visualization constructed using the vega-lite-api.
MIT Licensed


Comments
Sign in to join the discussion.