🌍 Public
Fork of Fork of Interactive Flower Timeline – Wedding Photography Market Growth 2
Uudjeffrey.jay@gmail.com
Last edited Feb 13, 2026
Created on Jan 28, 2026
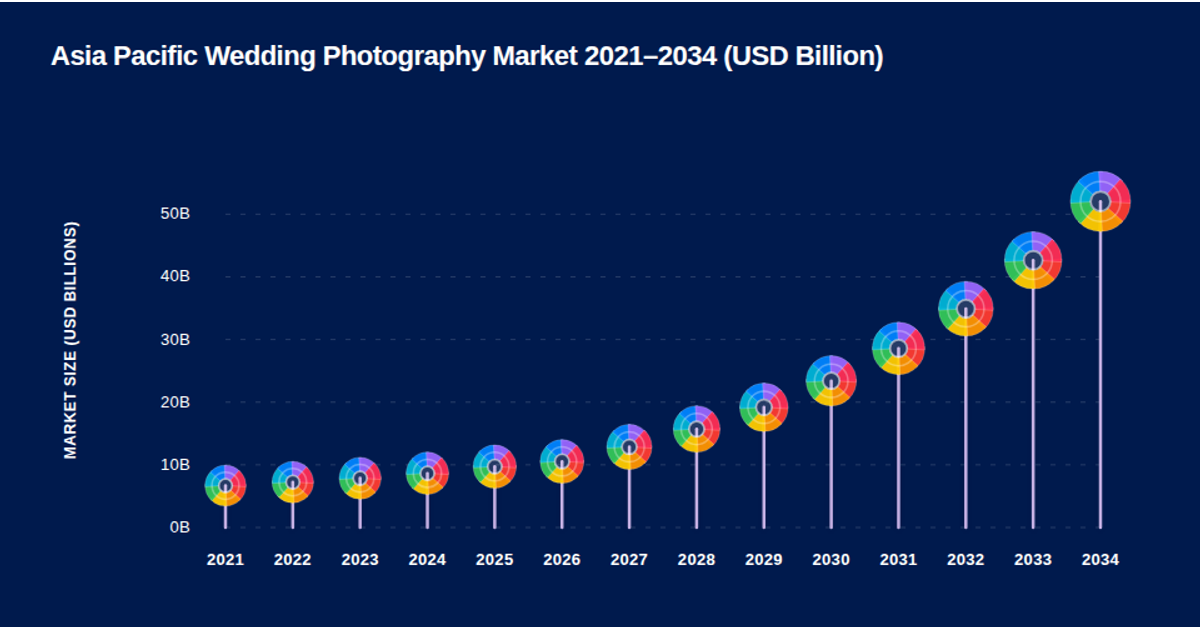
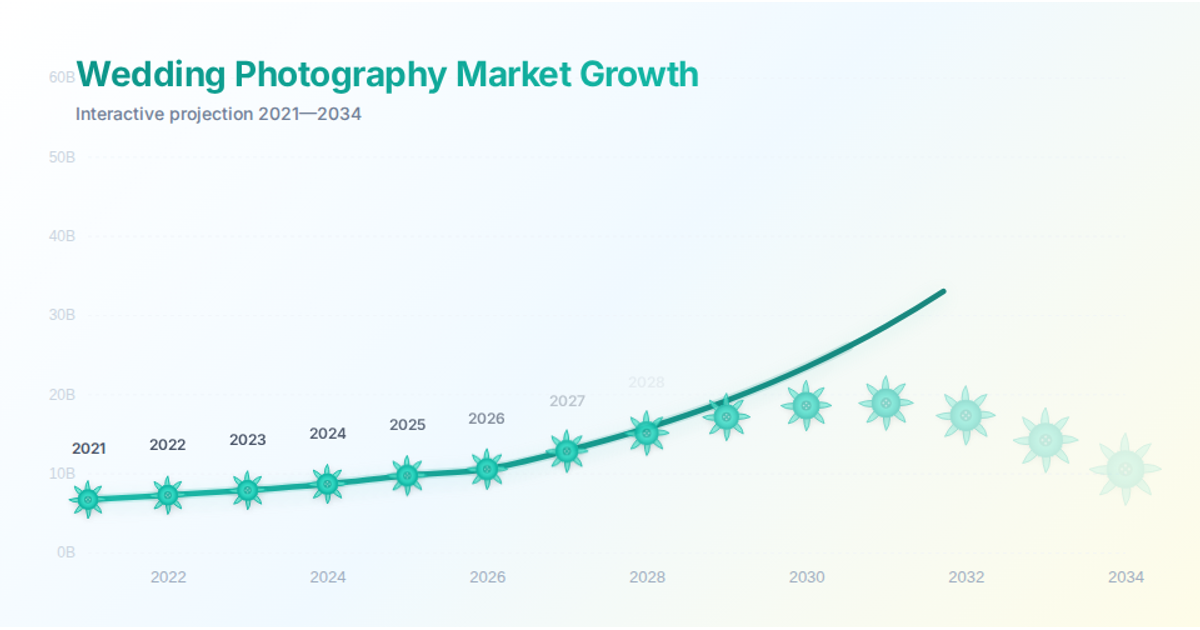
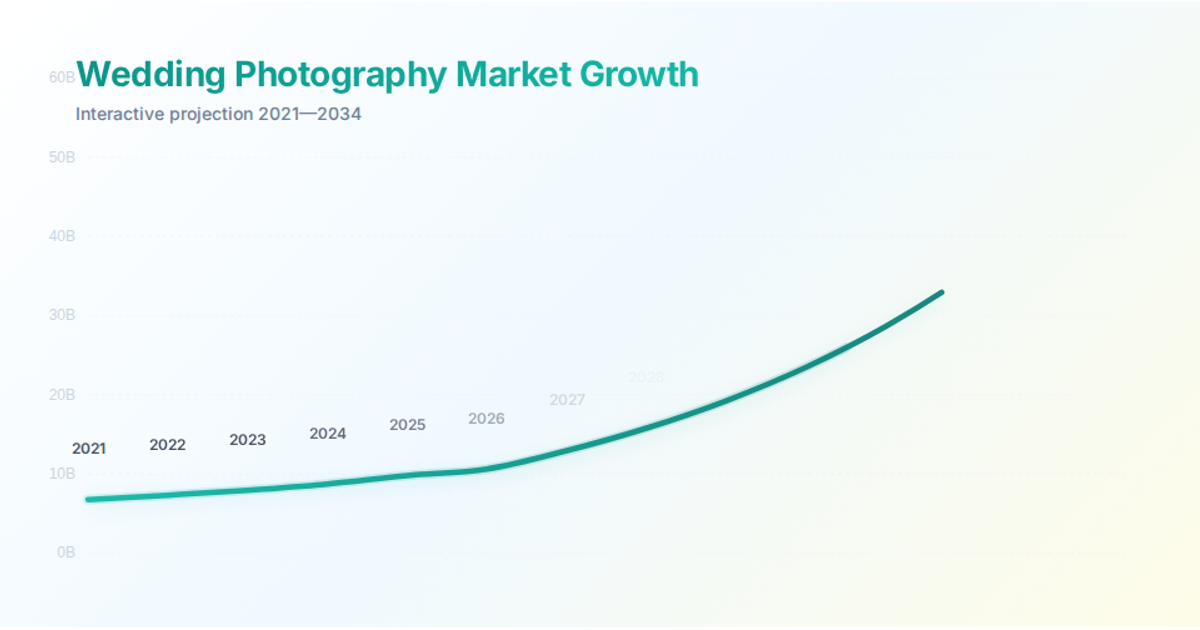
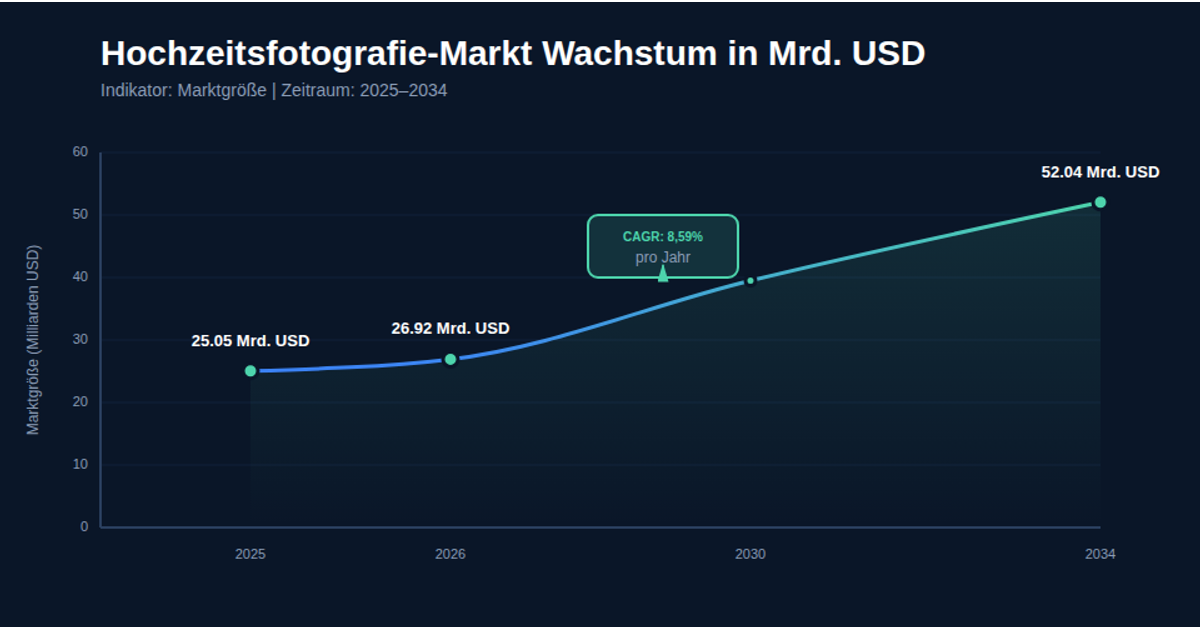
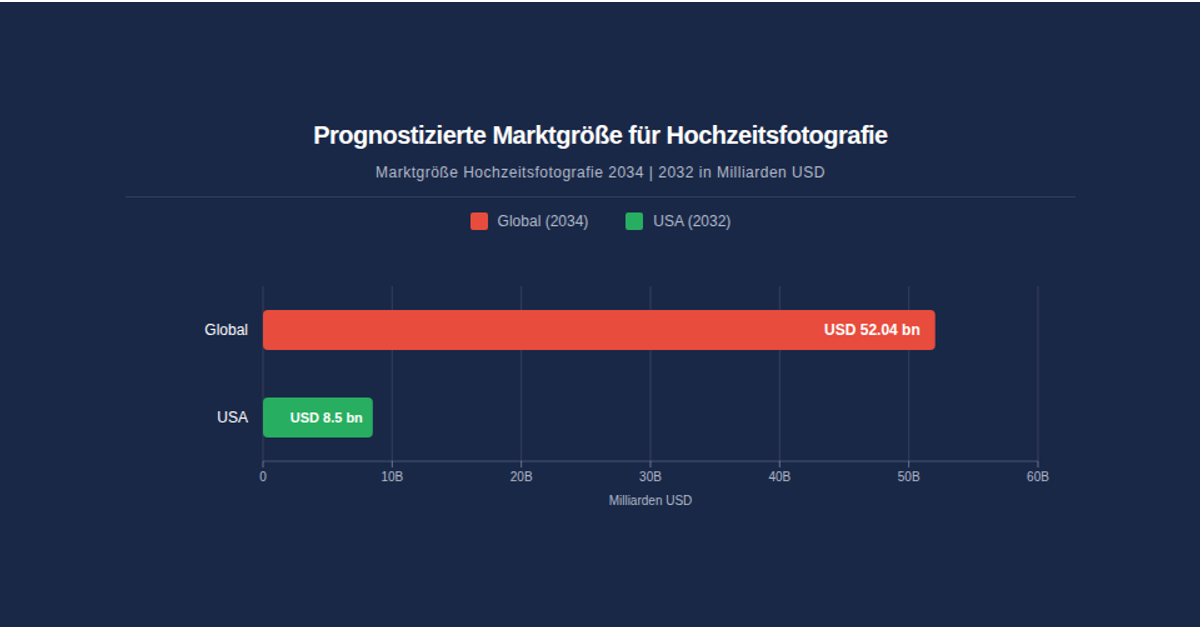
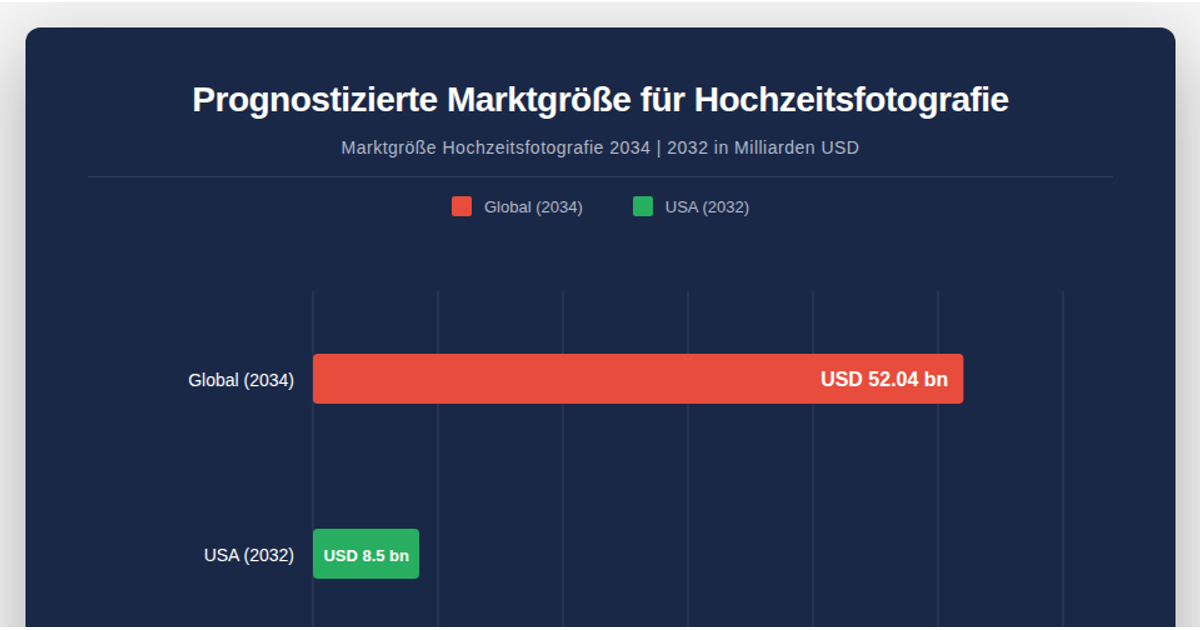
An interactive flower timeline visualizes wedding photography market growth in the Asia-Pacific region from 2021 to 2034. D3.js scales the size of camera-shutter icons by market value, with each year's bloom clickable to reveal a detailed tooltip. An animated line chart, gridlines, and axes frame the data, which is sourced from Fortune Business Insights in USD billions. React manages the interface, while D3's `scaleSqrt`, `transition()` with delays, and CSS animations bring the visualization to life.
AI-generated descriptionWedding Photography Market Visualization
An interactive D3.js + React visualization of the Asia-Pacific wedding photography market growth from 2021-2034.
Features
- Interactive Chart: Click on any year to view detailed market data
- Camera Shutter Design: Colorful animated shutter icons represent market value at each year
- Responsive Layout: Adapts to different screen sizes
- Data Visualization: Shows market growth trends with animated line chart and gridlines
Technology Stack
- React 19: UI framework
- D3.js 7: Data visualization
- CSS3: Styling and animations
Data
Market data sourced from Fortune Business Insights
- Years: 2021-2034
- Unit: USD Billions
- Region: Asia-Pacific
Project Structure
MIT Licensed


Comments
Sign in to join the discussion.