🌍 Public
Fork of Fork of Pathetic Bar Chart
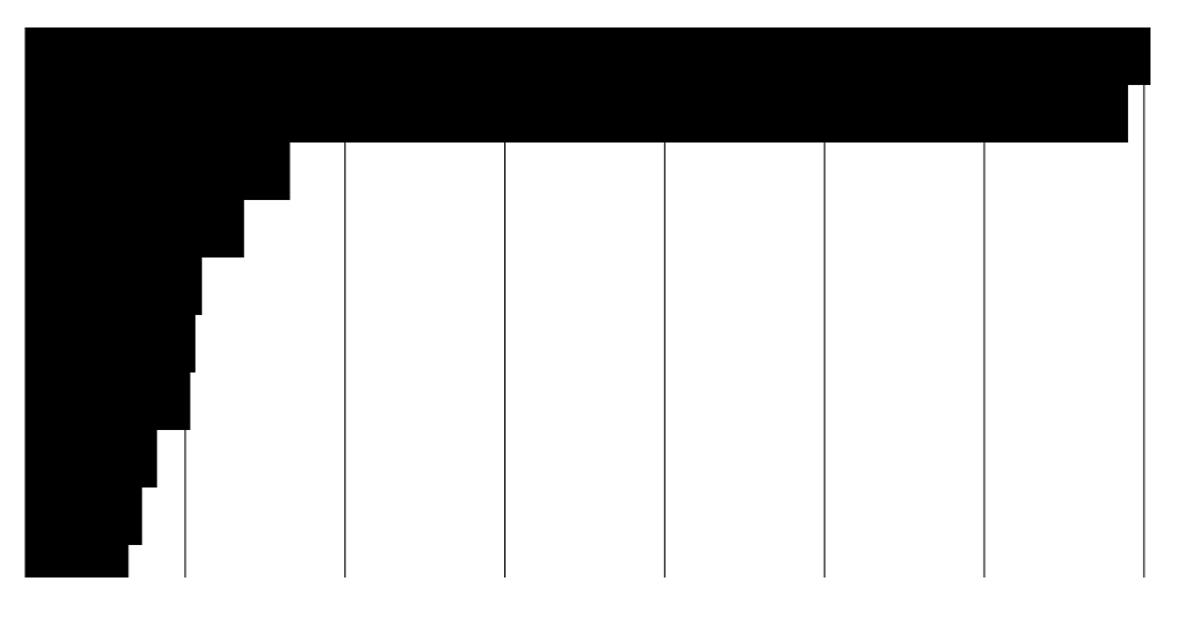
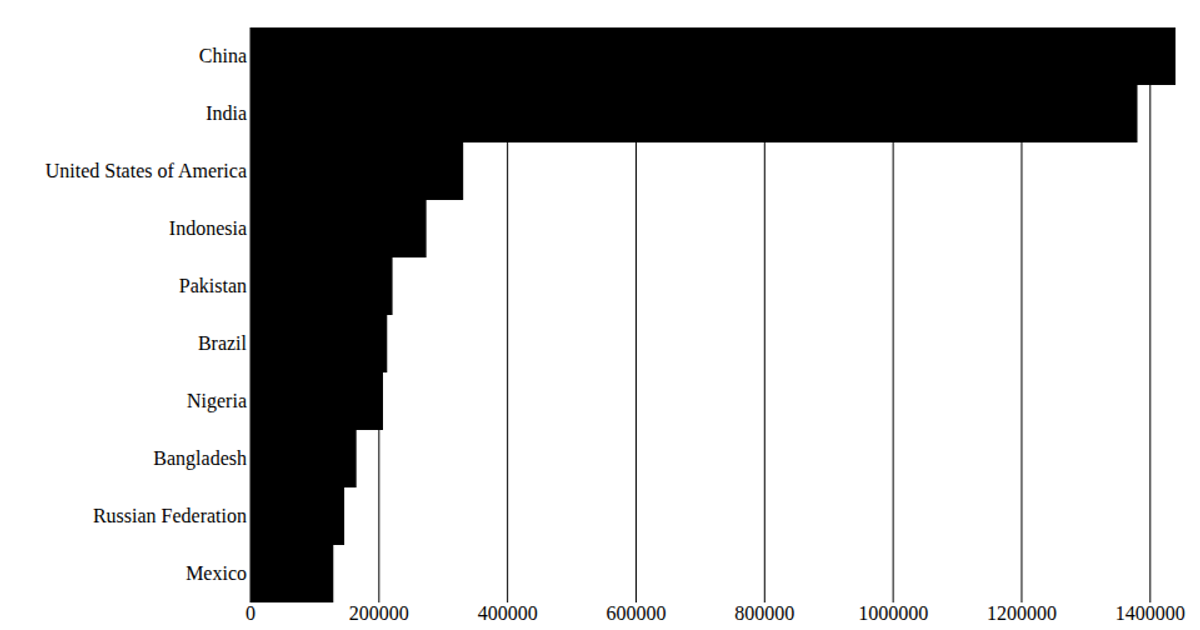
This example displays the top 10 most populous countries in 2020 as horizontal bars, with no axes or labels, creating a deliberately minimal "pathetic" bar chart. It uses React hooks to fetch and load data from a CSV file sourced from the United Nations World Population Prospects 2019, then renders SVG rectangles with d3.scaleBand for the y-axis positioning and d3.scaleLinear for the x-axis widths. The code also includes margins and an inner height calculation for the chart area, though the visible output omits tick marks and gridlines.
AI-generated descriptionA program that shows the top 10 most populous countries as a pathetic bar chart with no axes.
MIT Licensed





Comments
Sign in to join the discussion.