🌍 Public
maps
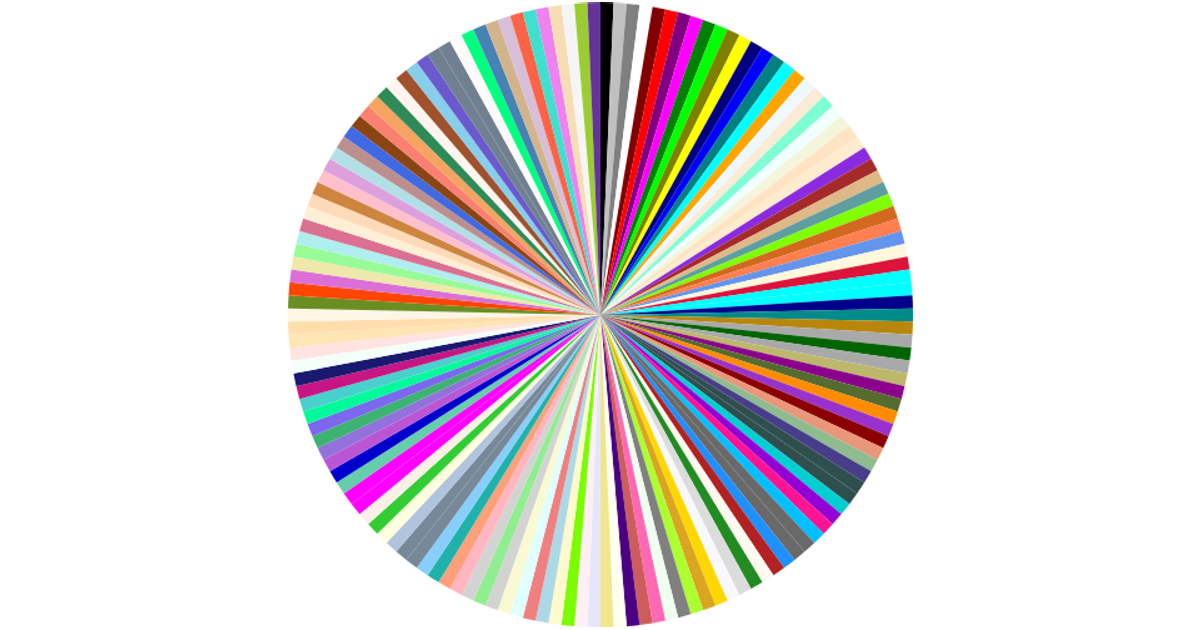
A pie chart renders the CSS named colors by loading their hex values from a CSV file with `d3.csv`. Each color occupies a slice, drawn as an SVG `path` using the `d3.arc` generator with a zero inner radius and the full chart width as outer radius. The `d3.pie` layout calculates slice angles, while React manages state and updates the visualization on data load.
AI-generated descriptionA program that loads data with D3 react
MIT Licensed






Comments
Sign in to join the discussion.