🌍 Public
Area Chart by Tejaswi_Tummala
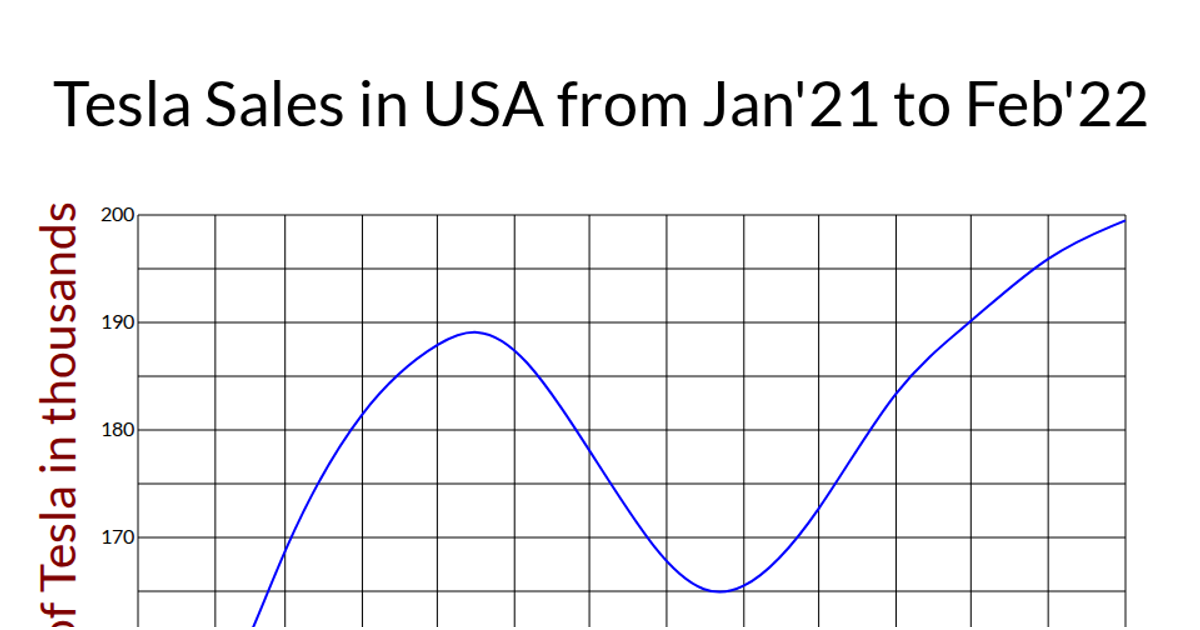
This area chart displays Tesla sales in the USA from January 2021 to February 2022, using a smooth curved line to connect monthly data points and a filled green area beneath it. The visualization is built with D3 v5, using `d3.scaleTime` and `d3.scaleLinear` for the x and y axes, while `d3.line` and `d3.area` generators apply `curveBasis` for smooth interpolation. Data is loaded from a CSV file via `d3.csv`, and the SVG includes gridlines, labeled axes, and a rotated y-axis title.
AI-generated descriptionA demonstration of how to start using D3 version 6.
MIT Licensed




Comments
Sign in to join the discussion.