🌍 Public
Fork of Making a Bar Chart
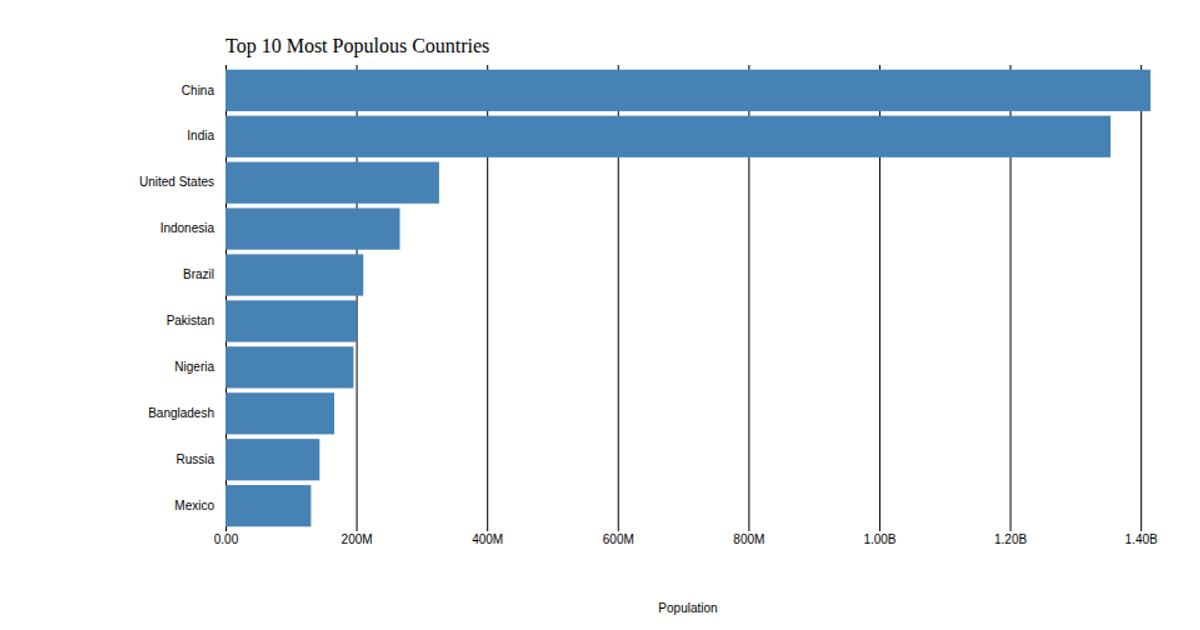
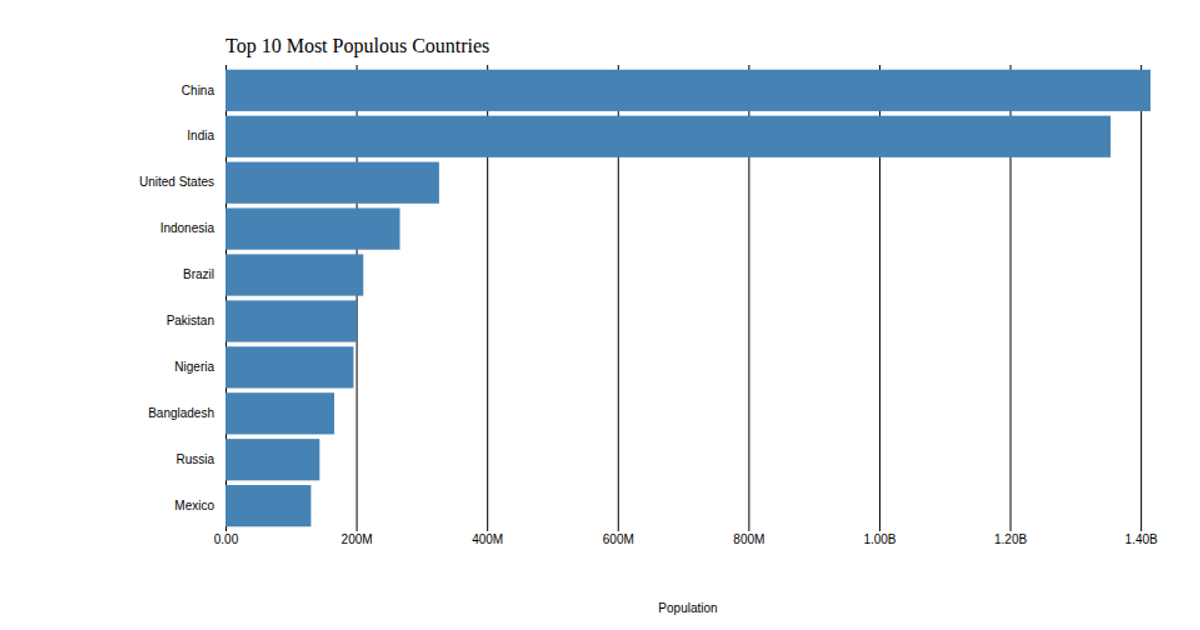
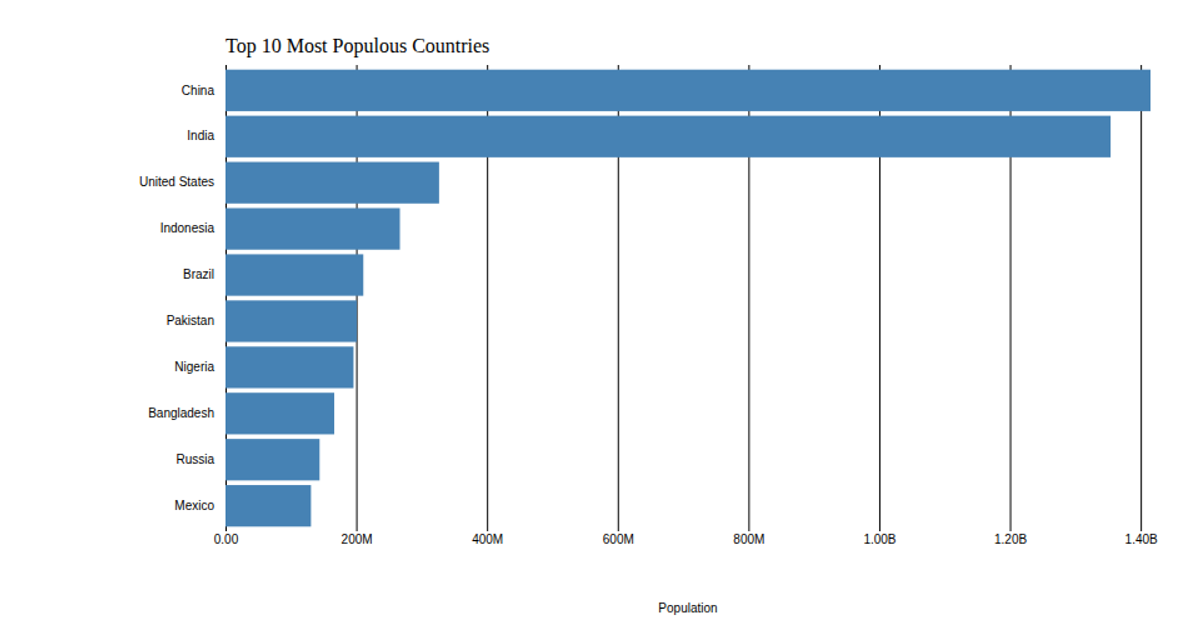
This bar chart visualizes the 2018 population estimates for the top 10 most populous countries, sourced from the United Nations World Population Prospects. The chart uses a linear x-scale and band y-scale, with axes customized through `axisLeft` and `axisBottom`, including tick removal and formatting. Rectangles are colored with a sequential viridis scale via `d3.scaleSequential` and `d3.interpolateViridis`. Data is loaded from a CSV using `d3.csv` and rendered in an SVG element. Axis labels and a title are added as text elements.
AI-generated descriptionThis bar chart shows population of the top 10 most populous countries. The data comes from the year 2018 estimate in United Nations: World Population Prospects 2017. It also demonstrates customization of D3 axes.
MIT Licensed



Comments
Sign in to join the discussion.