🌍 Public
Activity 6, Task-2
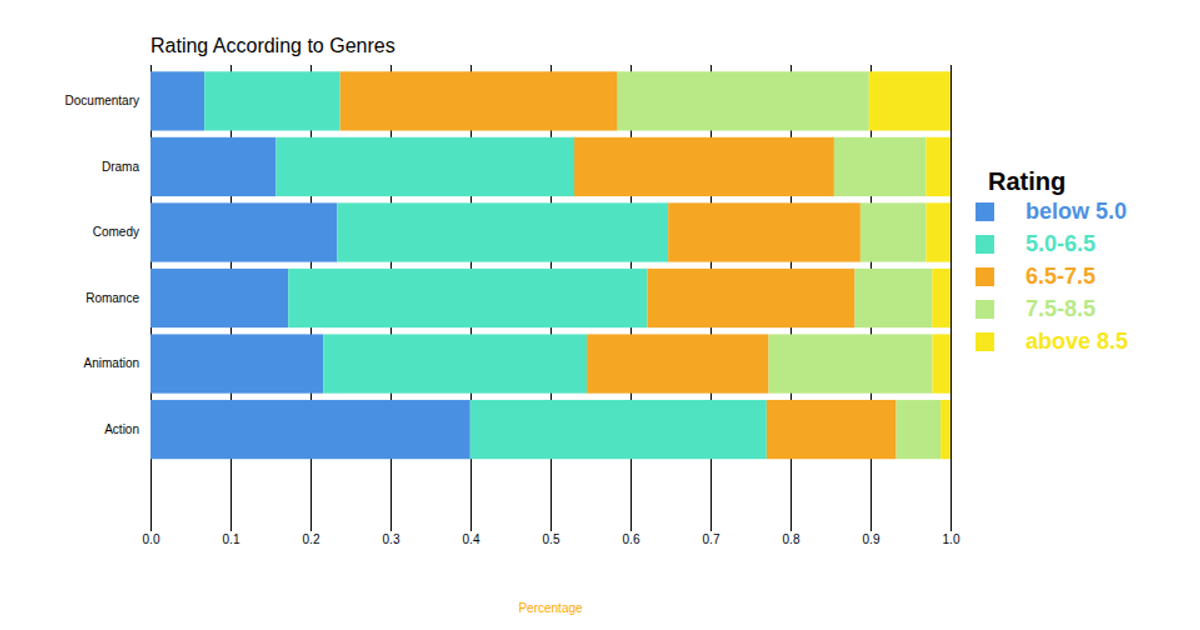
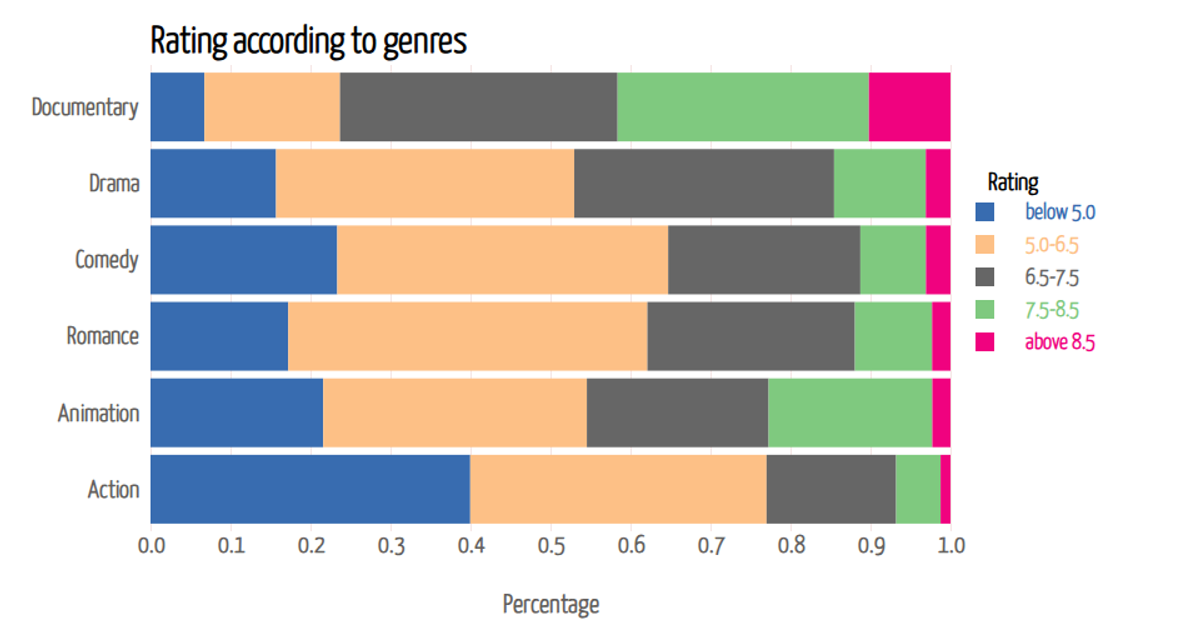
A stacked horizontal bar chart displays the percentage of movies across six genres, broken into five rating categories from “below 5.0” to “above 8.5.” Each genre row uses a color-coded segment for each rating bin, with hover tooltips revealing exact percentages. The chart is built with D3 v7, using `d3.stack()` to compute stacked series, `d3.scaleBand` for the y-axis, and `d3.scaleLinear` for the x-axis. Data comes from the local `data.csv` file, rendered as SVG with axes, labels, and interactive mouse events.
AI-generated descriptionAn example showing the capabilities of VizHub:
- Loads D3 via UNPKG.
- Demonstrates use of
importfrom"d3". - Demonstrates use of
importfrom local ES6 modules.
MIT Licensed





Comments
Sign in to join the discussion.