🌍 Public
AnithaShivaramaiah (11537410) 3D Bar Chart with D3.js
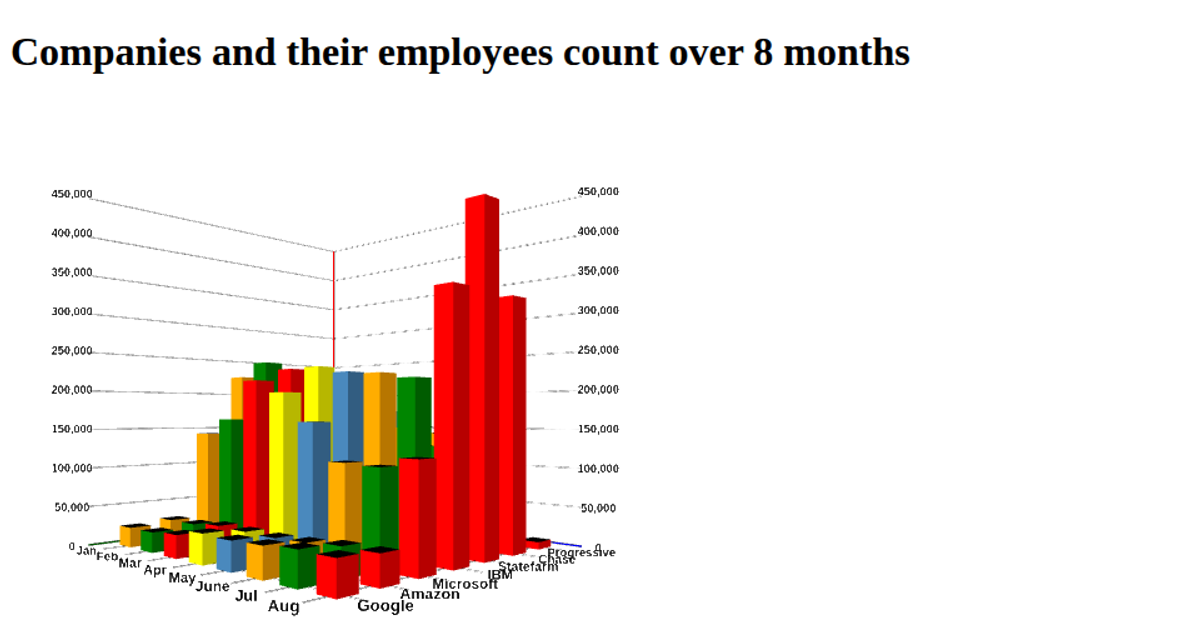
This example shows monthly expenses from January through December for multiple expense categories as a 3D multi-series bar chart. The chart renders in an X3DOM scene, driven by the d3-x3d library alongside d3-3d, with D3 v5 loading CSV data from a GitHub gist. The code uses `d3.csv` to parse the data, `d3.select` to attach the chart to a div, and the `d3.x3d.chart.barChartMultiSeries()` component to generate the 3D visualization. Axes and scales are not explicitly customized, relying on the chart component’s defaults.
AI-generated descriptionA bare minimum HTML page demonstrating use of CSS and JavaScript.
See also React Starter.
MIT Licensed


Comments
Sign in to join the discussion.