🌍 Public
test
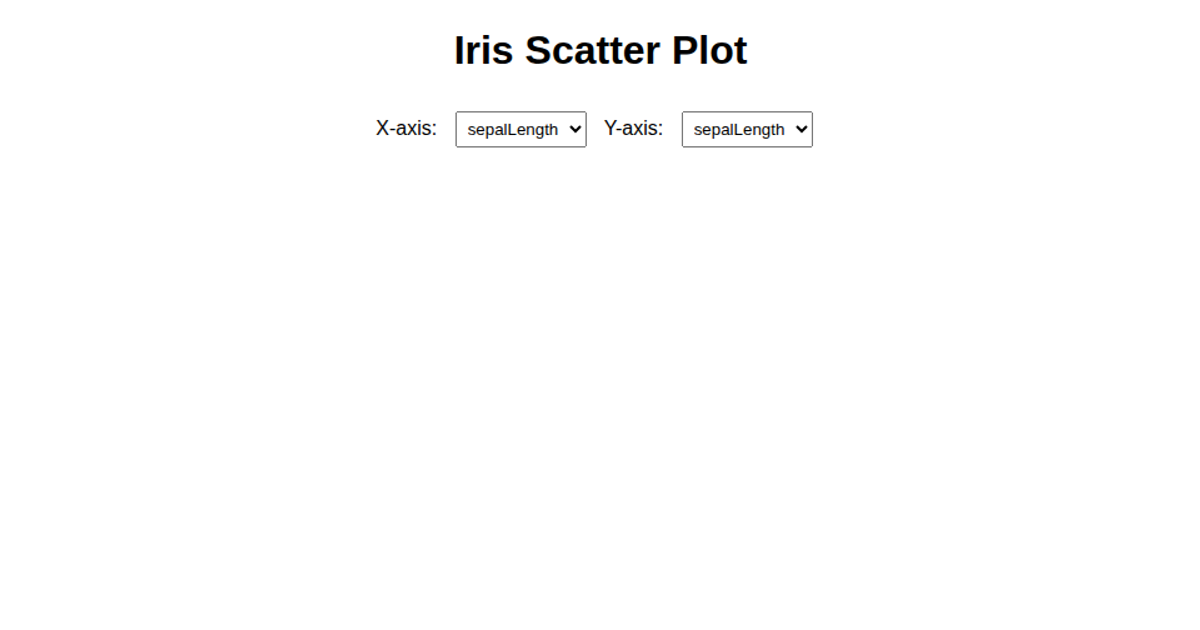
This interactive scatter plot explores the classic Iris flower dataset by allowing users to select which measurements to compare on the x and y axes via dropdown menus. The visualization uses D3.js v5 with SVG and animated transitions to render the data points. As users change the axis selections, the plot re-renders with a smooth delay effect, with each circle animating from the center. The code specifically uses `d3.scaleLinear`, `d3.extent`, `d3.axisBottom`, and `d3.axisLeft` to build the scales and axes.
AI-generated descriptionThis scatter plot shows data about cars, from UCI Machine Learning Repository: Auto MPG Data Set.
MIT Licensed





Comments
Sign in to join the discussion.