🌍 Public
React Color Legend
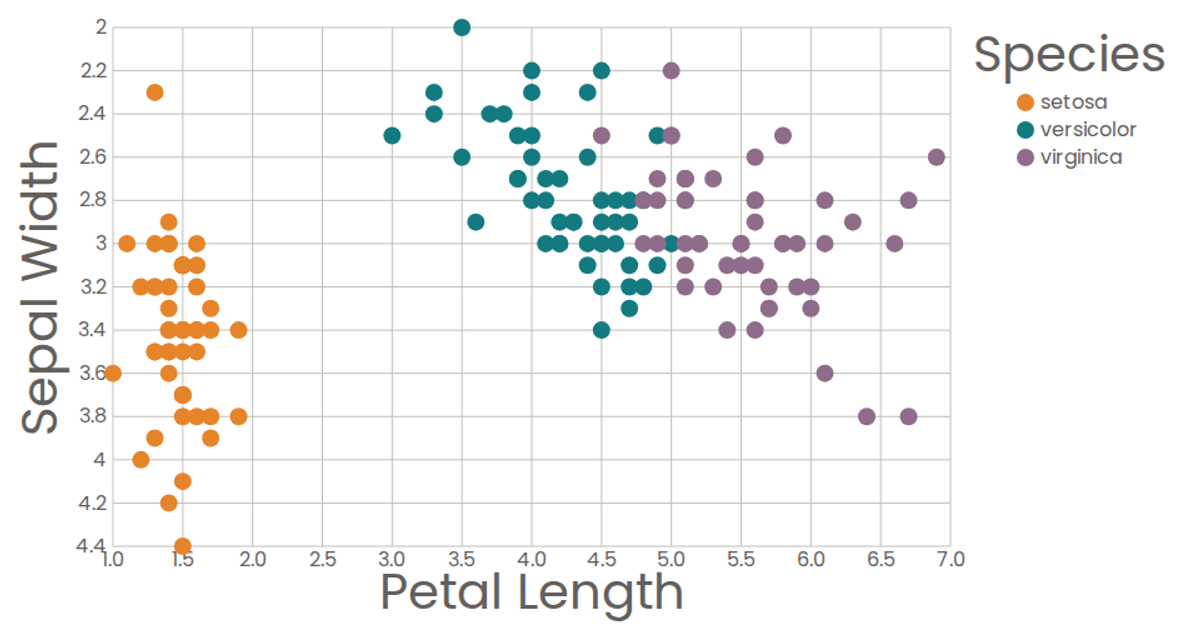
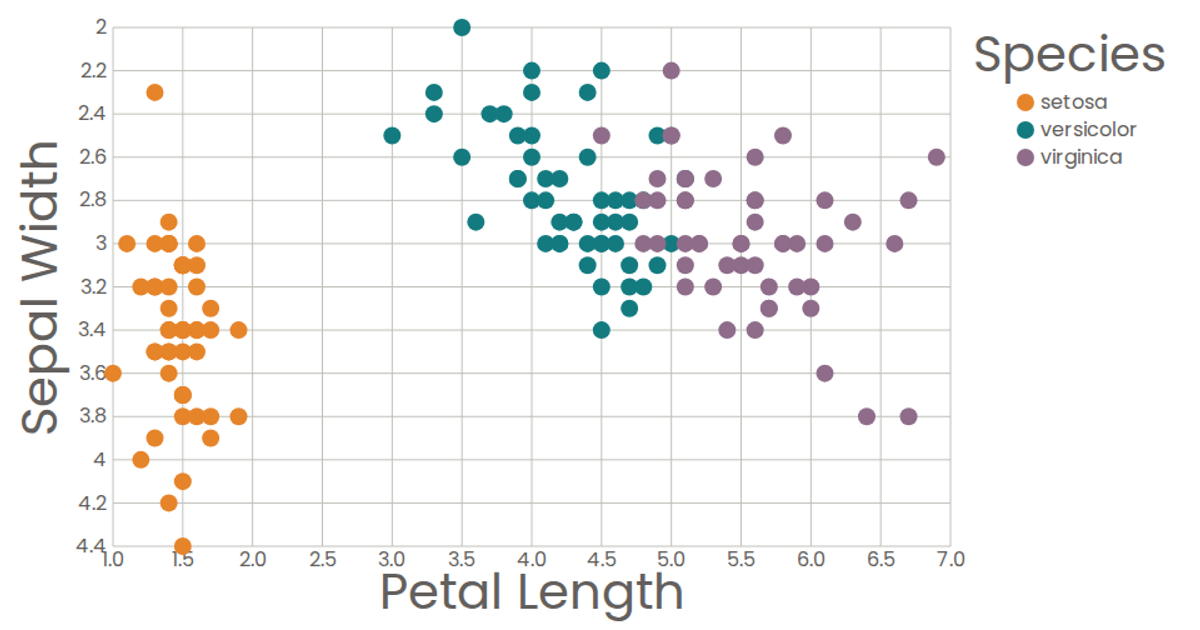
An interactive scatter plot of the Iris dataset rendered in SVG using React and D3, comparing petal length against sepal width with points colored by species via `d3.scaleOrdinal`. A custom React color legend component displays the three species, and hovering over a legend entry fades non-matching points to 20% opacity while re-rendering only the selected species highlights on top. Axes are generated with `d3.scaleLinear`, `d3.extent`, and `d3.format`, with data loaded asynchronously through D3’s `csv` parser.
AI-generated descriptionA scatter plot of The Iris Dataset.
MIT Licensed




Comments
Sign in to join the discussion.