🌍 Public
Read in JSON department files
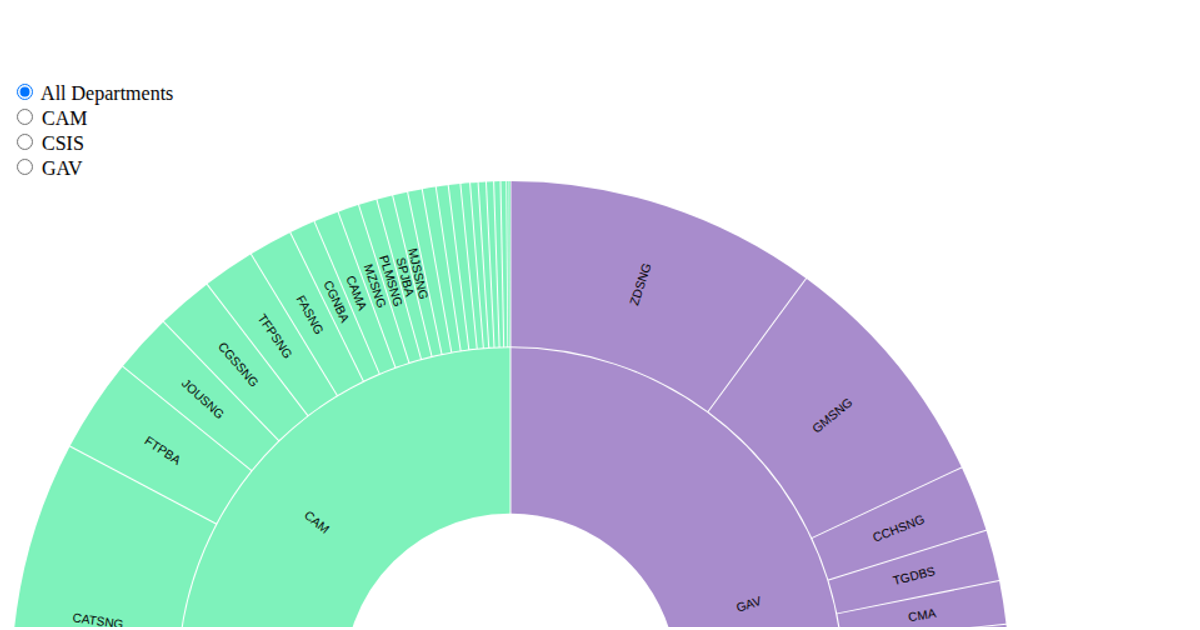
A zoomable sunburst visualization displays student enrollment counts by gender across university departments and courses. Three radio buttons filter the view to specific departments. The visualization loads data from three JSON files using `Promise.all` and `d3.json`, building a hierarchical structure with `d3.hierarchy` and `d3.partition`. The code uses `d3.arc` to render the sunburst segments and includes interactive zooming via click handlers.
AI-generated descriptionMIT Licensed




Comments
Sign in to join the discussion.