🌍 Public
Let's make a map with D3.js!
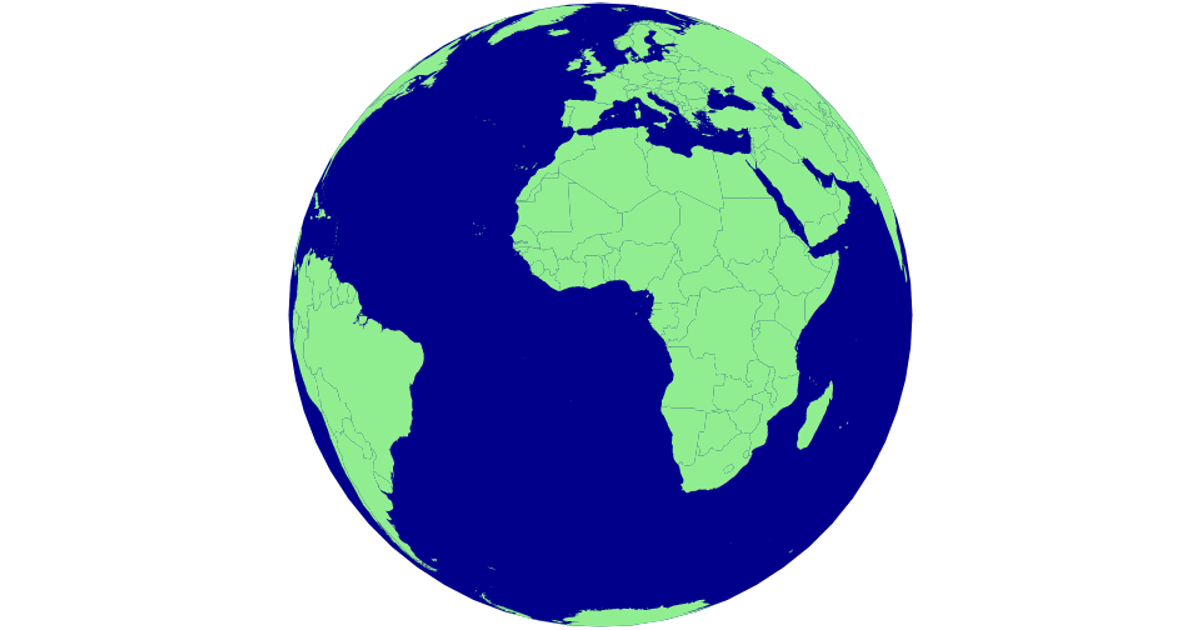
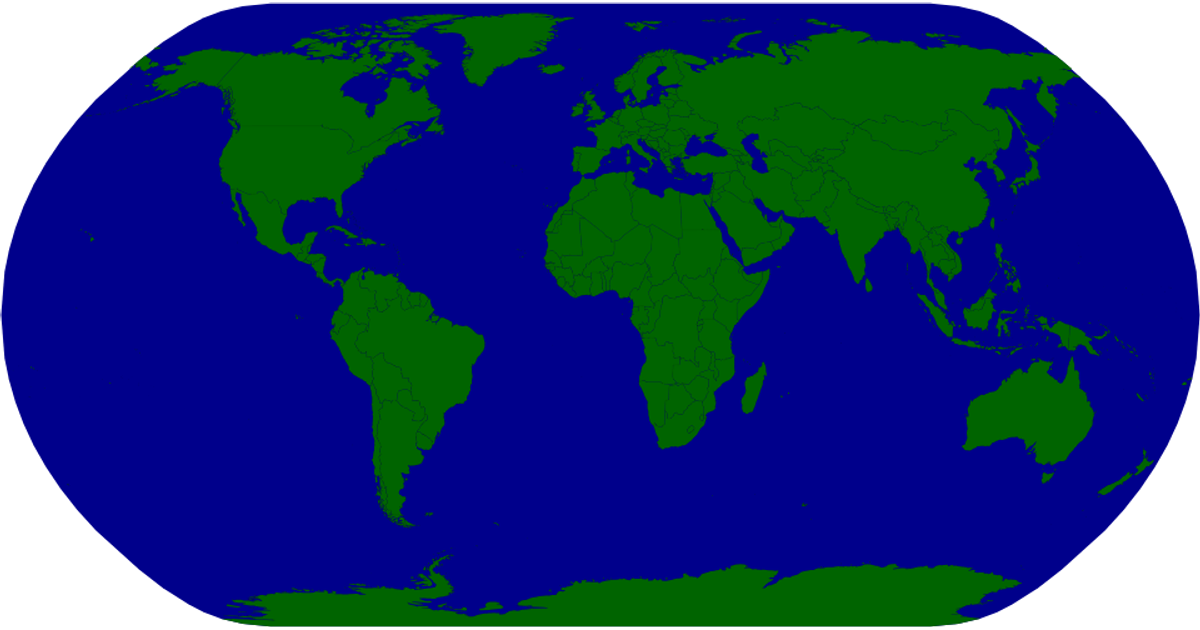
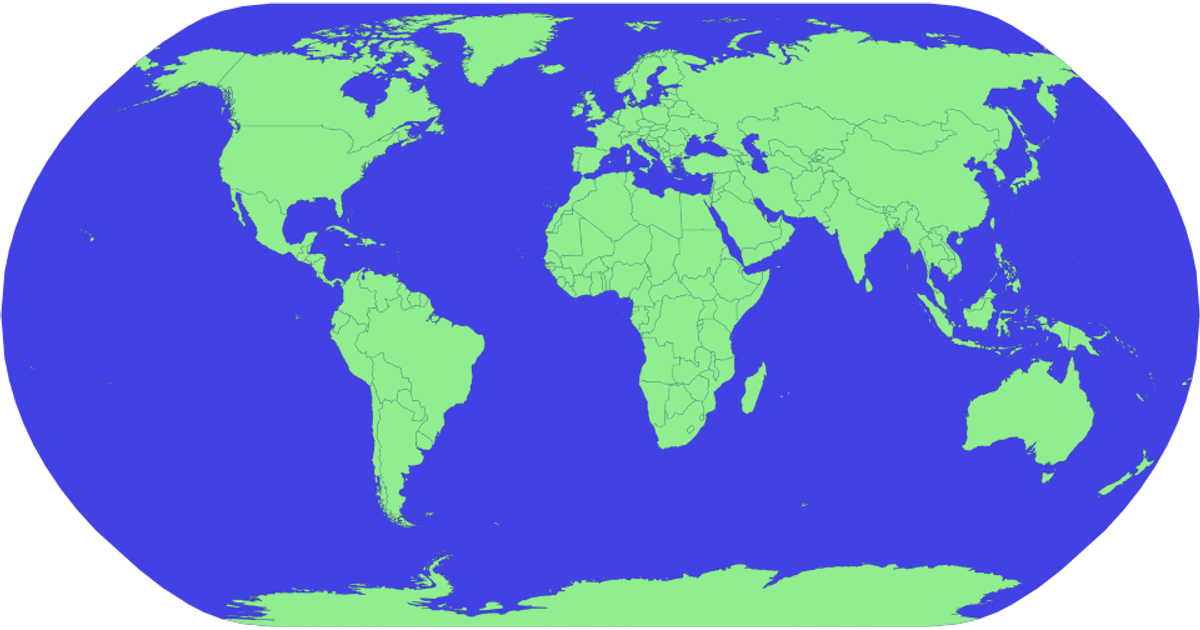
This interactive SVG map visualizes world countries, highlighting each one in red on hover and displaying its name via a tooltip. Built with D3.js v5, it uses `geoMercator` projection and `geoPath` to render geographic features from TopoJSON data, while country names are loaded from a TSV file. The map supports zooming through D3's `zoom` event, which transforms the map group.
AI-generated descriptionMIT Licensed


Comments
Sign in to join the discussion.