🌍 Public
NE Consumption
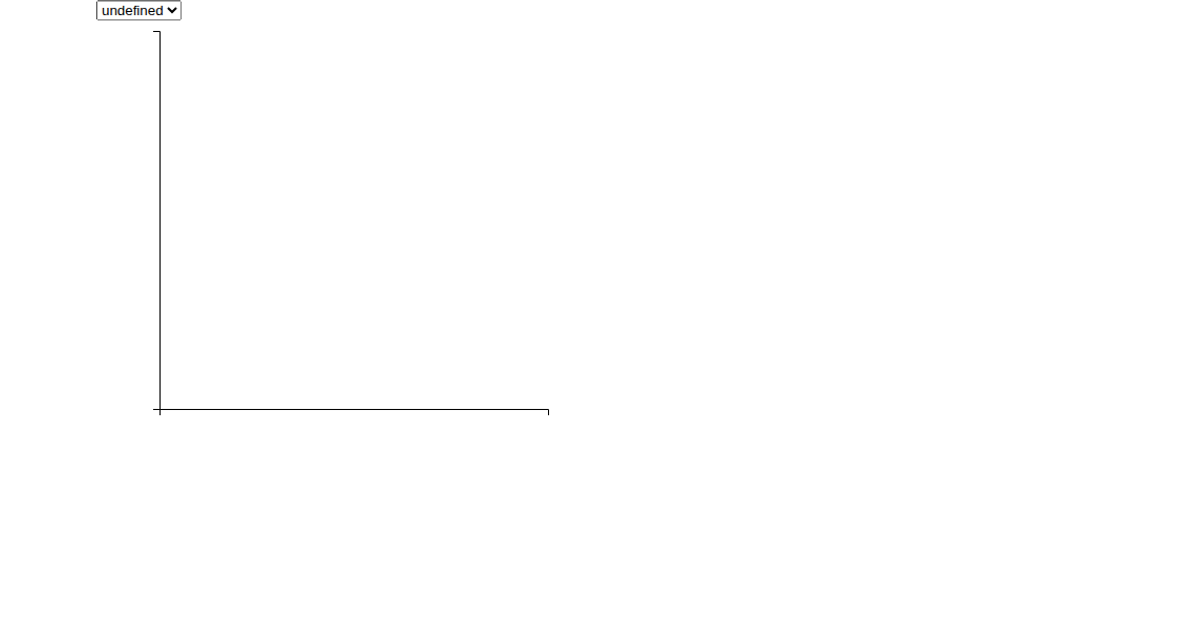
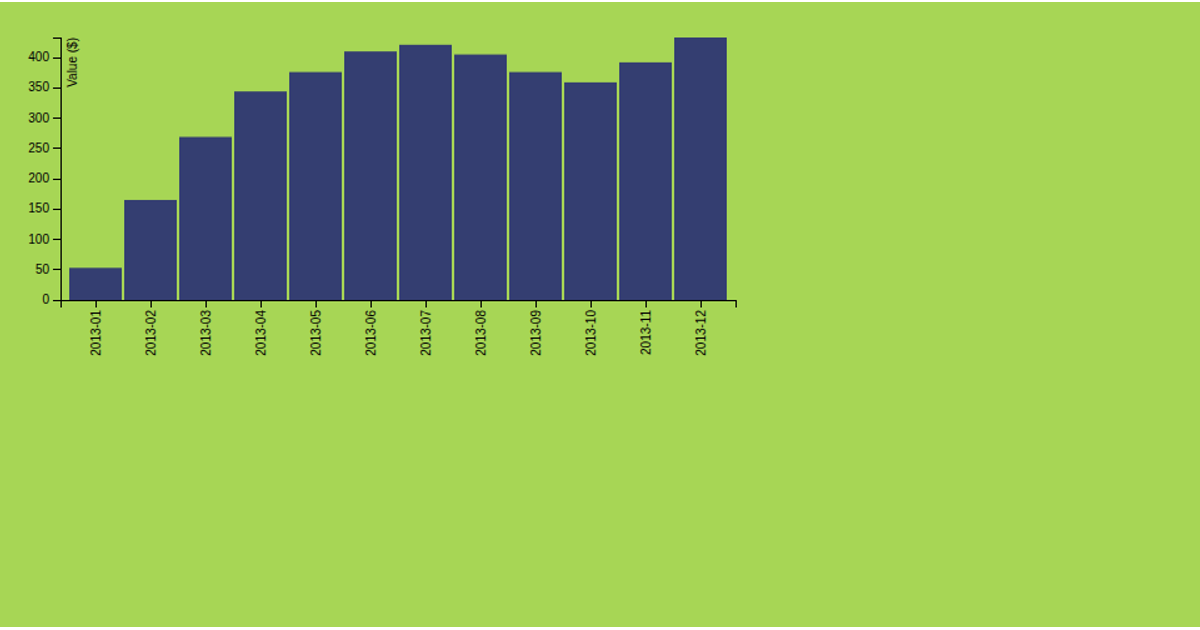
This visualization displays the total dead and missing migrants for each month in a date histogram. The chart aggregates data from the Missing Migrants Dataset, with the y-axis showing monthly sums of energy consumption in kilowatt-hours across the NorthEast sector. Built with React and D3 v5, the visualization uses `d3.bin` and `d3.sum` to group and aggregate the data, with axes and bars rendered as SVG elements. Interactive dropdown menus filter the x-axis by Region, Urban Status, Housing Type, Year Built, or Household Income.
AI-generated descriptionA date histogram showing the sum total dead and missing migrants for each month.
Data from the Missing Migrants Dataset.
MIT Licensed




Comments
Sign in to join the discussion.