🌍 Public
Fork of Stylized Line Chart
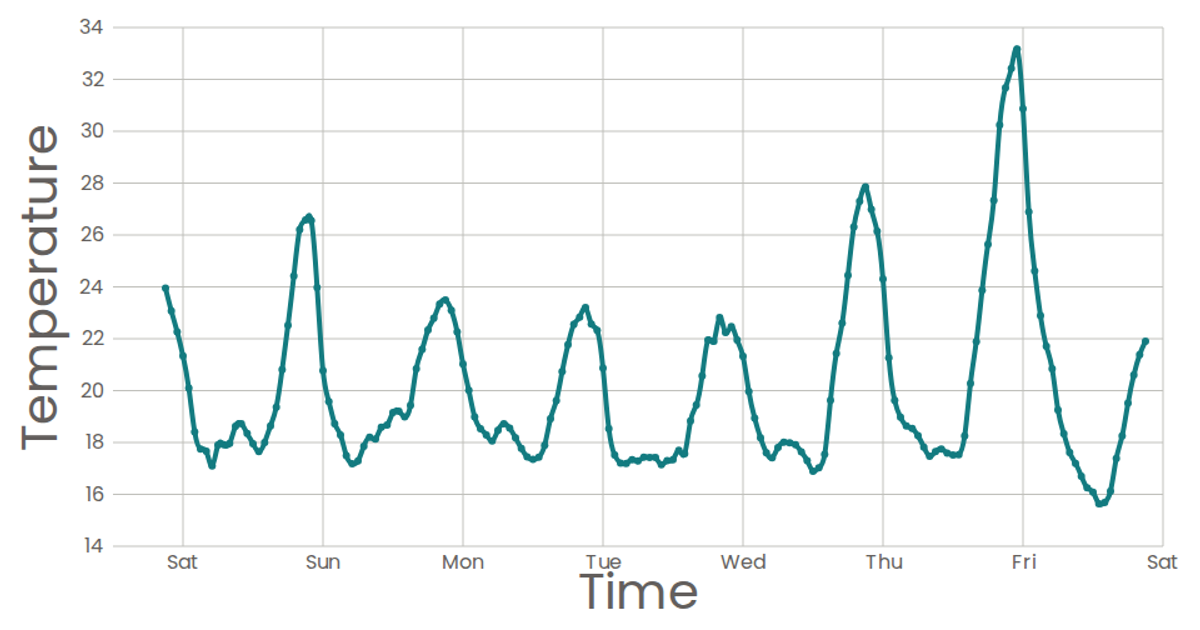
This example visualizes weekly temperature trends in San Francisco using a stylized area chart. The x-axis maps time with a time scale, while the y-axis maps temperature with a linear scale, and the area path uses d3.area with a natural curve to create a smooth, orange-filled region. React renders the SVG components, including custom AxisBottom and AxisLeft components that generate ticks and gridlines, while d3.csv loads the Dataset for Sense Your City data. The chart displays axis labels for time and temperature, with a clean Poppins font styling.
AI-generated descriptionA scatter plot of Data Canvas Sense Your City Dataset.
MIT Licensed




Comments
Sign in to join the discussion.