🌍 Public
ICE-5: Welcome to Satish Data visualization
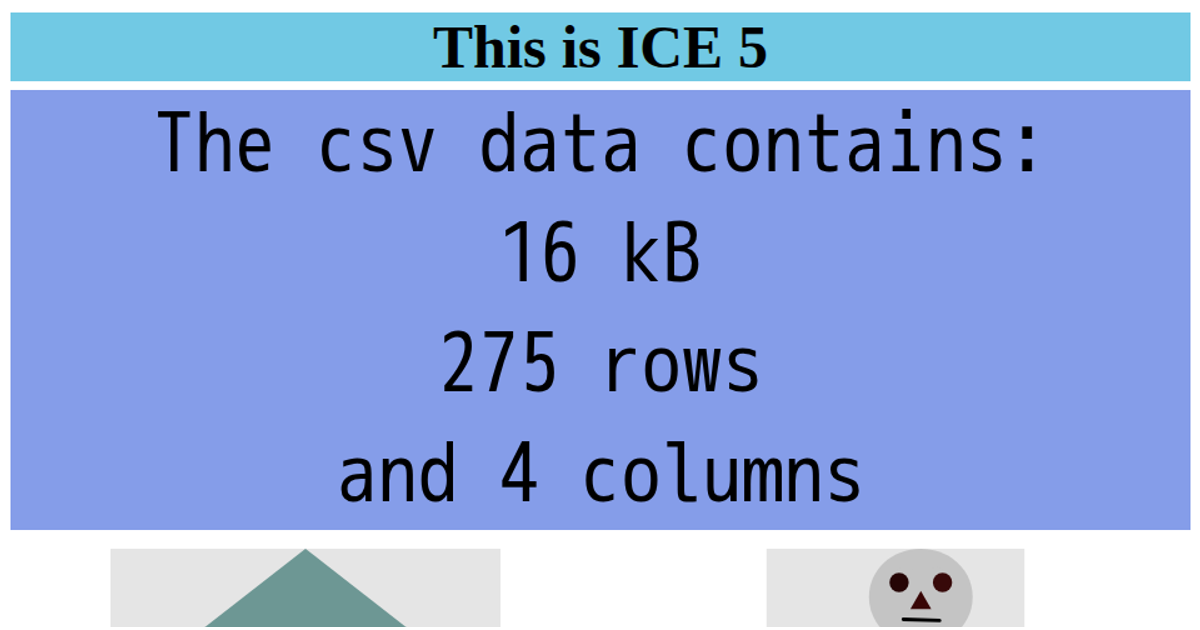
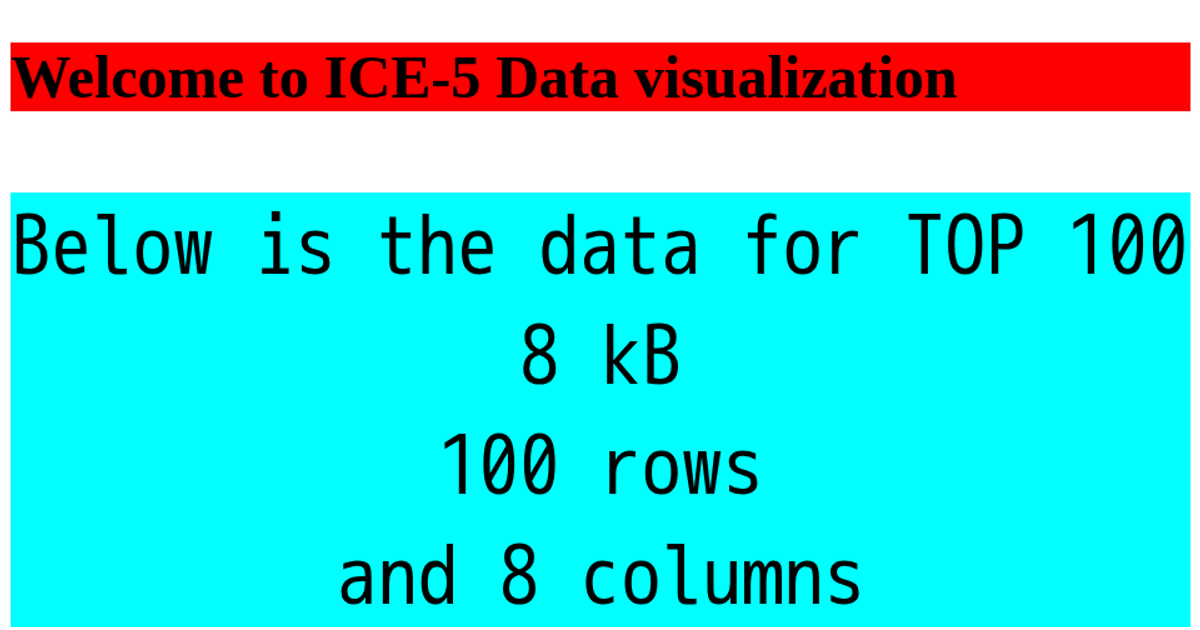
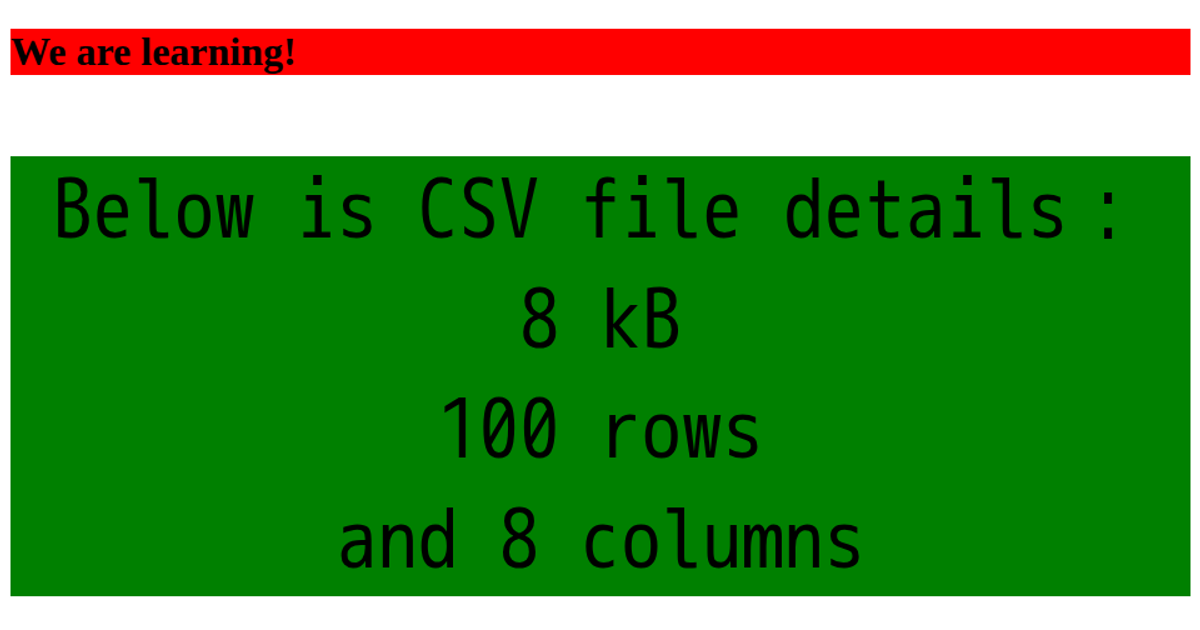
ICE-5: Welcome to Satish Data visualization presents a single-page D3.js v7 example. It displays a bold heading and a large pre-formatted text block summarizing a remote CSV file's size, row count, and column count. The page prominently features a full-width bike SVG image loaded directly from a GitHub URL. The visualization uses the `d3.csv` and `d3.csvFormat` APIs to fetch and analyze the Sathish.csv dataset, rendering the summary statistics in a styled `pre` element alongside the imported bike graphic.
AI-generated descriptionMIT Licensed




Comments
Sign in to join the discussion.