🌍 Public
SwedisH MAP
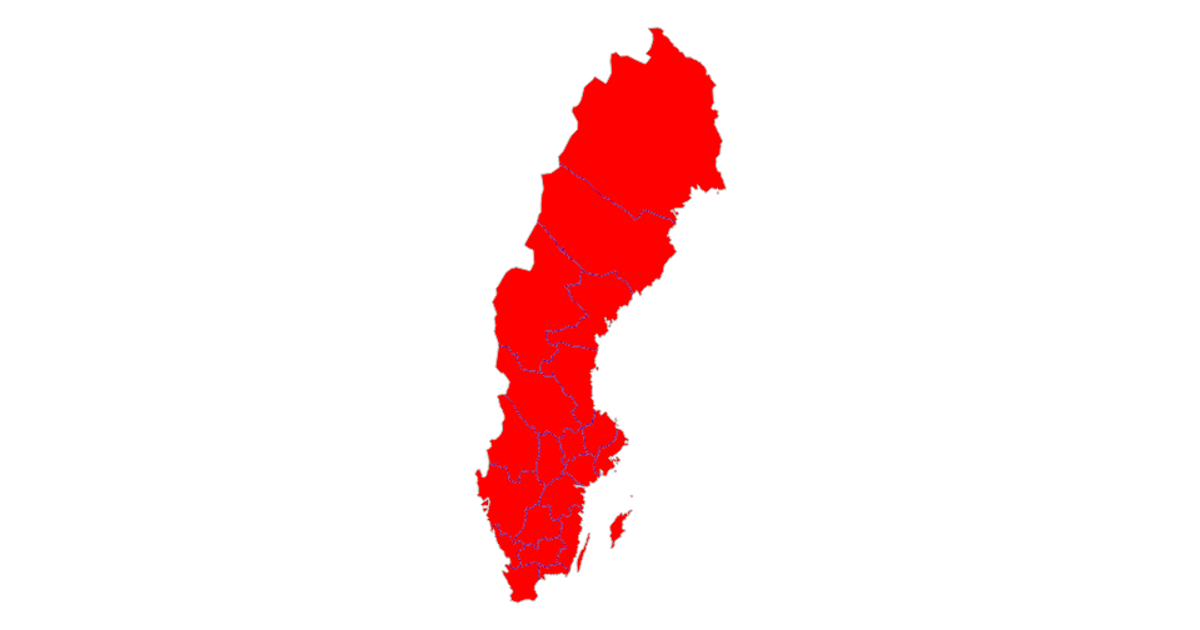
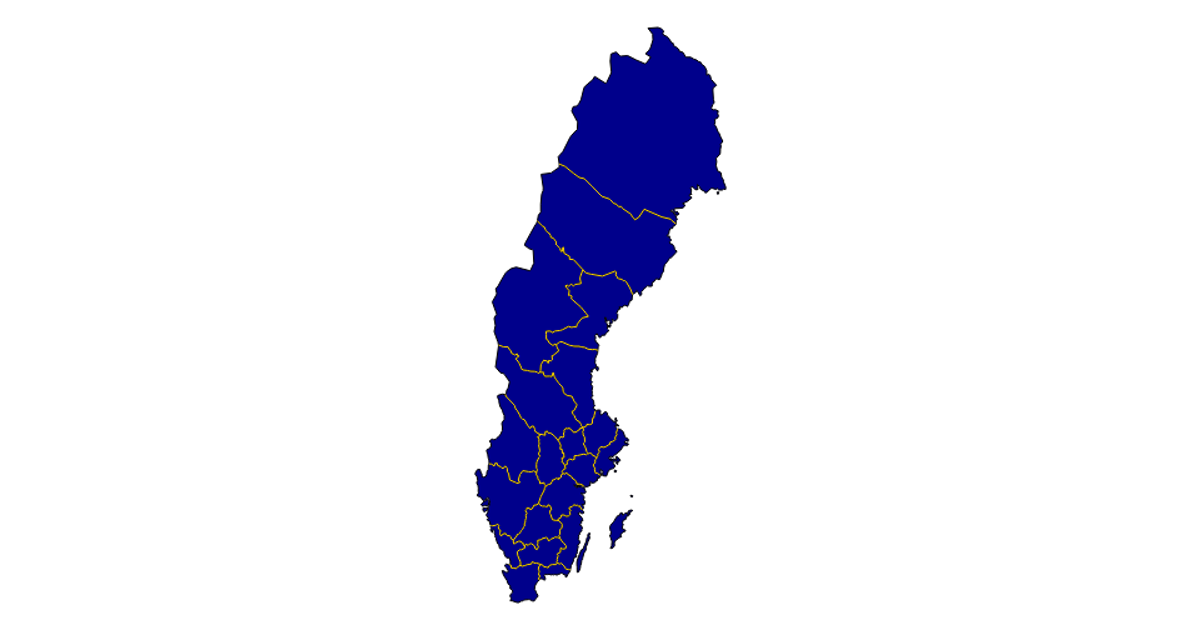
This example displays a choropleth-style map of Swedish counties, rendered as SVG paths with cyan fills and green boundary lines between regions. The visualization uses a React component structure with D3’s `geoMercator` projection and `geoPath` to draw geographic features from TopoJSON data. The map is loaded via the `json` method and processed with `feature` and `mesh` from the TopoJSON library, with the projection fitted to the viewport using `fitExtent`.
AI-generated descriptionA scatter plot of Data Canvas Sense Your City Dataset.
MIT Licensed





Comments
Sign in to join the discussion.