🌍 Public
adding zoom button to the graph
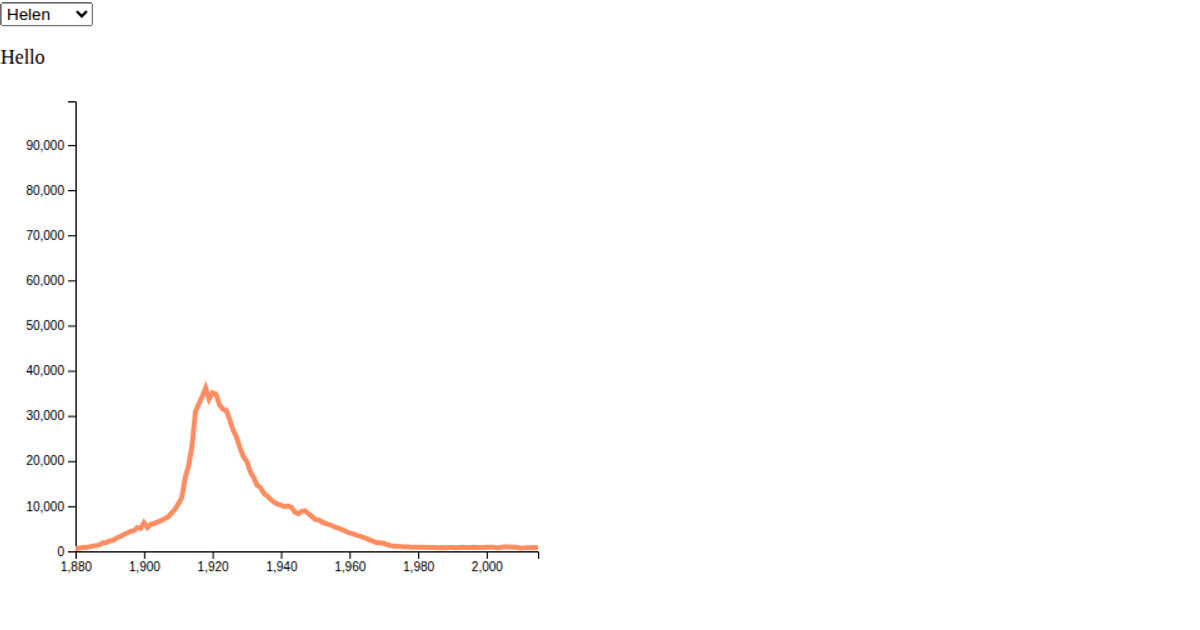
This example shows a time-series line chart of average closing prices, filtered by product through a dropdown menu. The visualization uses React with D3 v5 scales (`scaleTime`, `scaleLinear`) and axis components, rendering an SVG path via `d3.line` with `curveNatural`. Data loads asynchronously from a CSV URL using `d3.csv`, with the y-axis domain recalculated from the filtered dataset. Hover tooltips are commented out, leaving only the dropdown-driven product selection as the interactive element.
AI-generated descriptionWorking with time
MIT Licensed




Comments
Sign in to join the discussion.