🌍 Public
Fork of Hello Observable Plot
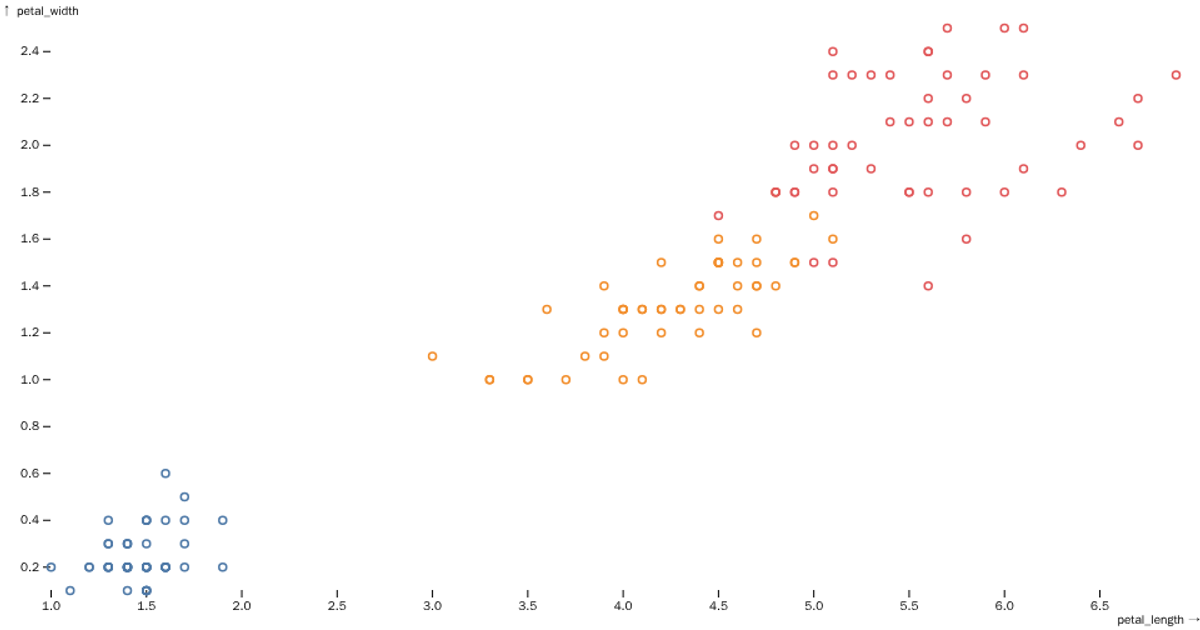
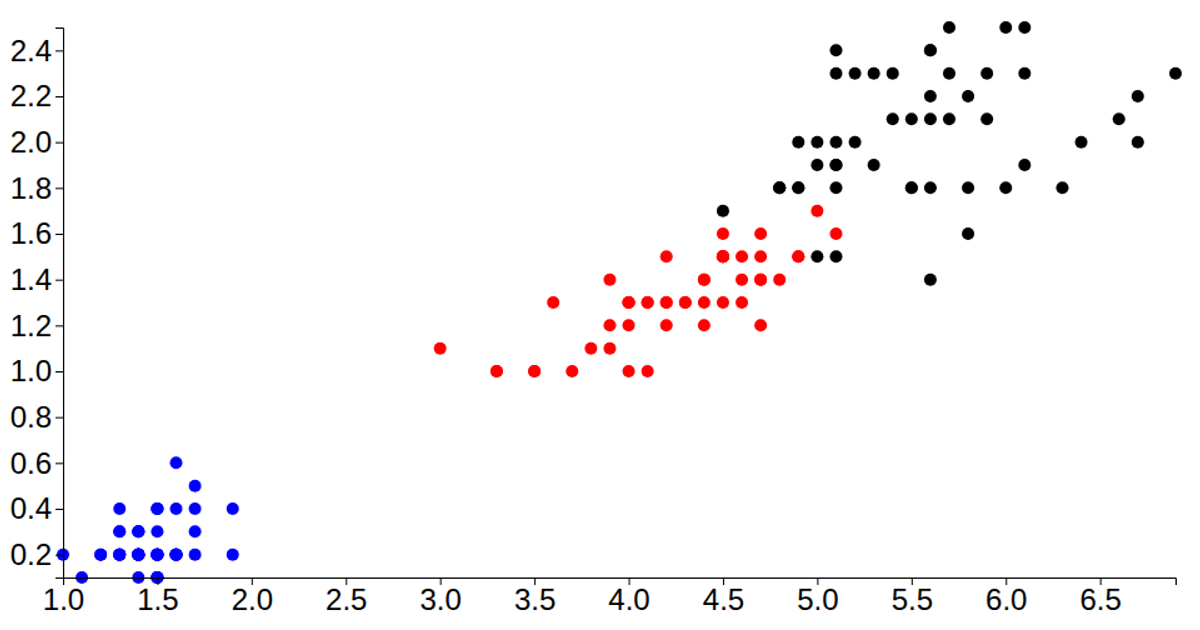
This example renders the classic Iris dataset as a scatter plot using Observable Plot, with petal length on the x-axis, petal width on the y-axis, and species encoded by stroke color. The visualization fills the entire browser window by setting the plot’s width and height to the inner dimensions of the viewport. The code loads data with `d3.csv` and `autoType`, then builds the chart with the `plot` and `dot` functions from the Observable Plot UMD bundle, while relying on D3 v6 for data parsing.
AI-generated descriptionMinimal example demonstrating use of Observable Plot with vanilla HTML.
MIT Licensed





Comments
Sign in to join the discussion.