🌍 Public
Experimenting
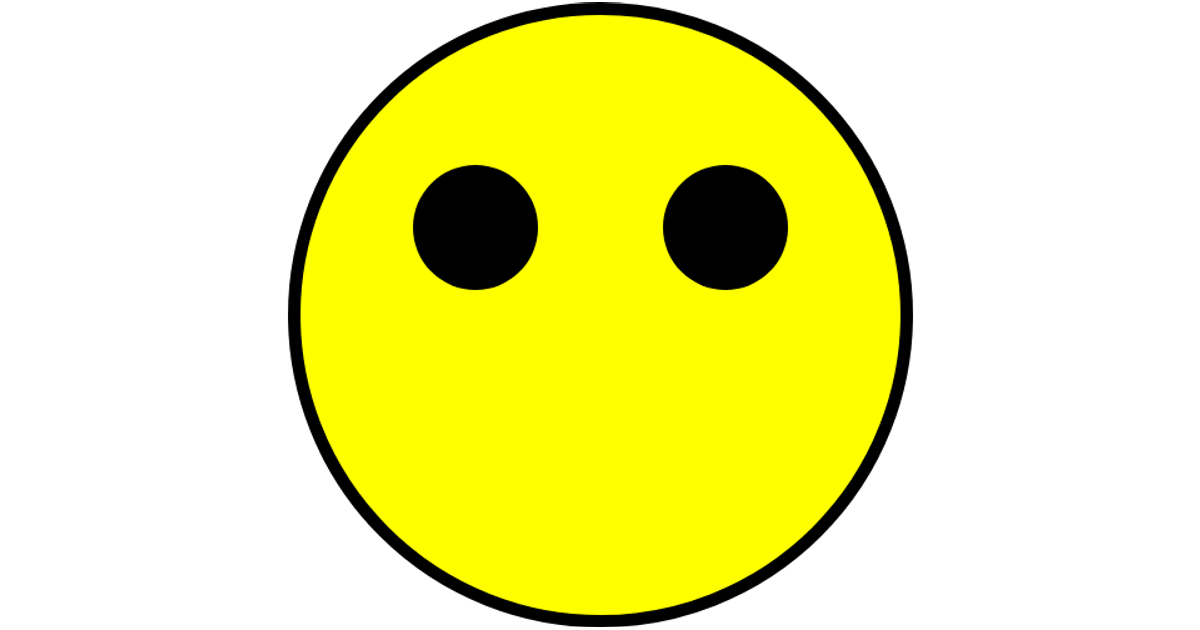
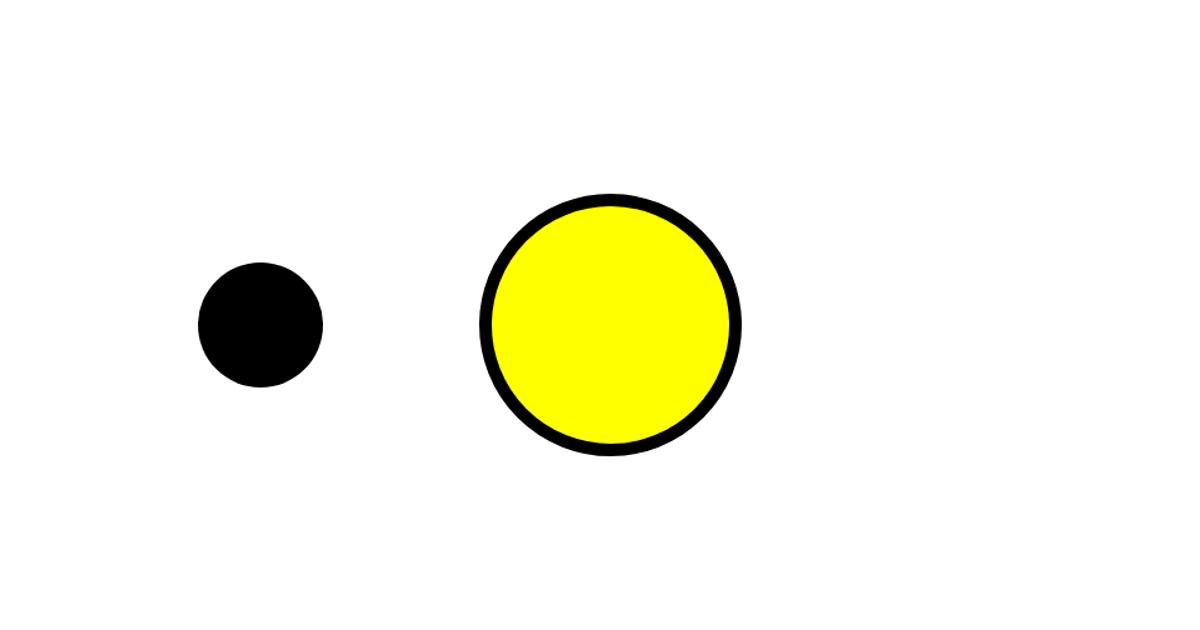
This example experiments with a static vector graphic: a yellow circle with a thick black outline, accompanied by two smaller black circles. The visualization is rendered as an SVG element, with coordinates and radii defined directly in the markup. The code includes React and ReactDOM, and the index.js file demonstrates rendering a separate "Hello JSX" element, though the visible graphic is static and does not respond to user interaction or animate. The SVG uses basic shapes without D3 or other plotting utilities.
AI-generated descriptionMIT Licensed




Comments
Sign in to join the discussion.