🌍 Public
This is so cool "Map function inside Map function"
NNita
Last edited Feb 25, 2020
Created on Feb 25, 2020
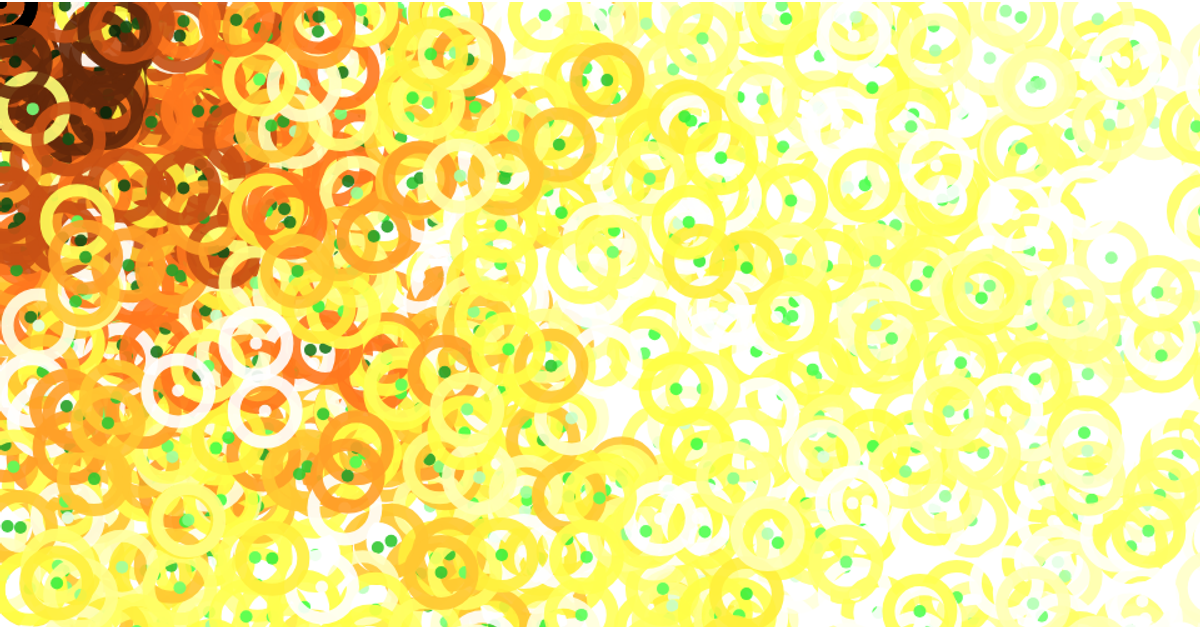
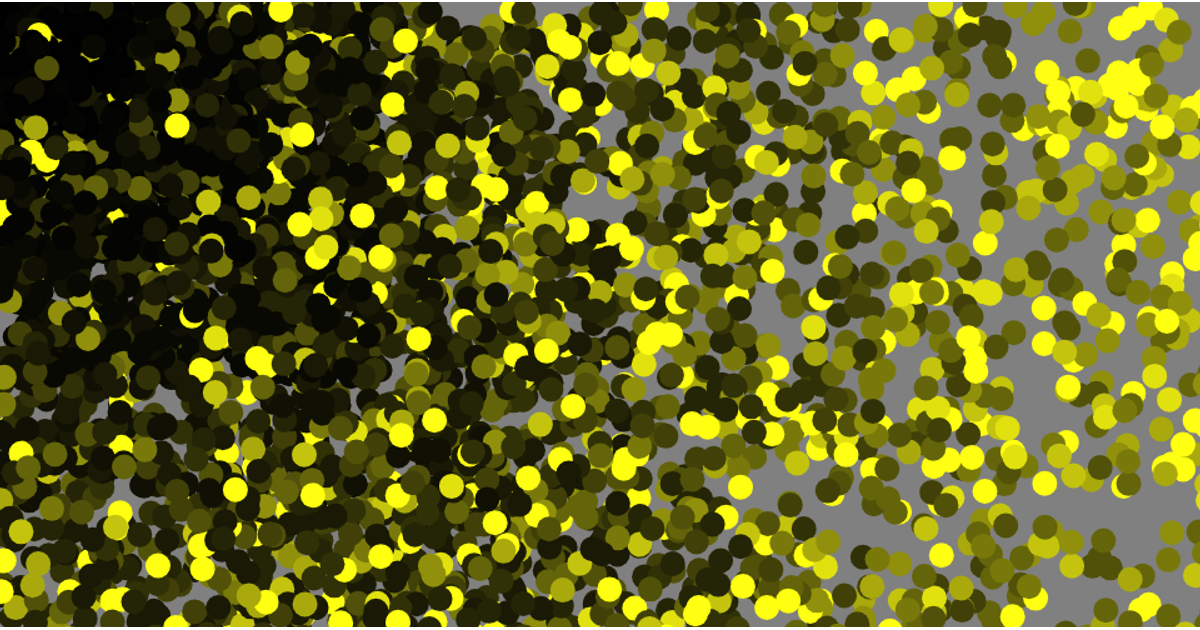
This example generates a dense scatter of overlapping circles across an SVG canvas, with each circle’s position, fill color, and stroke determined by nested `Array.map` calls over a fixed array of numbers from 0 to 100. It uses React and ReactDOM to render the circles, computing `cx` and `cy` coordinates via `Math.random` multiplied by the array values, producing a chaotic, colorful grid-like pattern. The fill and stroke colors are derived from the same array indices using template literals, and all circles share a constant radius of 5 pixels.
AI-generated descriptionThese are the circles created with react.
MIT Licensed





Comments
Sign in to join the discussion.