🌍 Public
STarda - Activity 9 - Question 2
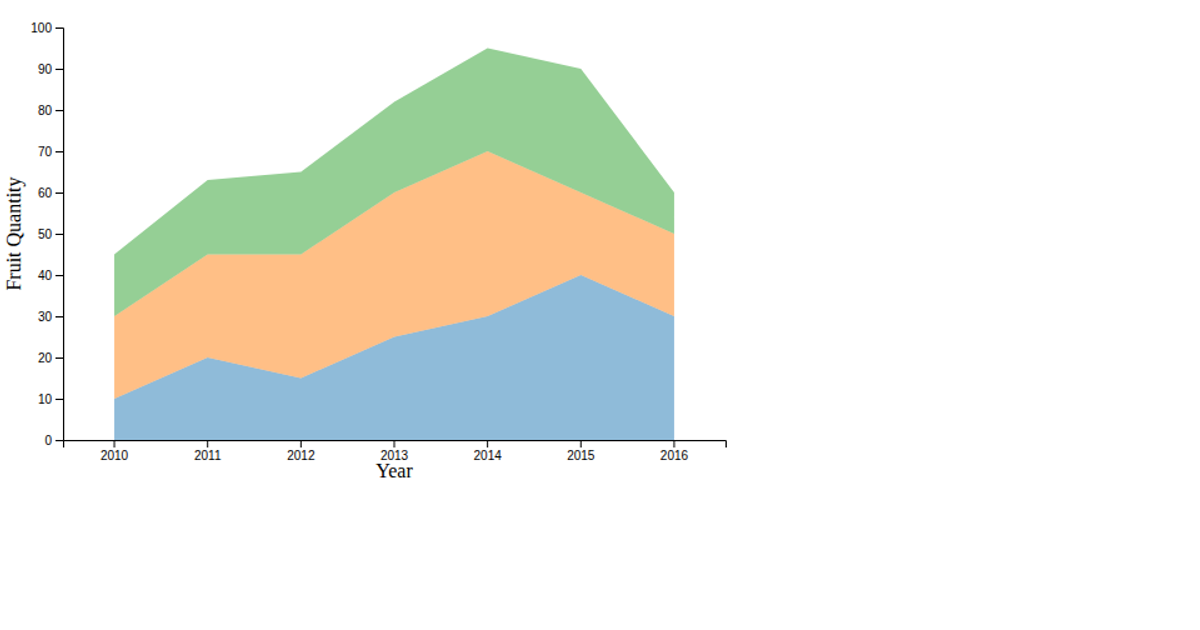
This stacked area chart displays discount amounts across six categories—Corporate, Family, Healthcare, Military, Sibling, and Teacher—for a series of data points loaded via d3.tsv from a tab-separated dataset. The chart uses d3.stack() to layer the categories and d3.area() with linear x and y scales to render SVG paths, with d3.schemeTableau10 providing color encoding. Missing values default to zero, and the visualization includes axes, labels, a title, and a legend.
AI-generated descriptionMIT Licensed



Comments
Sign in to join the discussion.