🌍 Public
A8 - Adjacency Matrix in D3
RRiya Mathur
Last edited Mar 26, 2024
Created on Mar 25, 2024
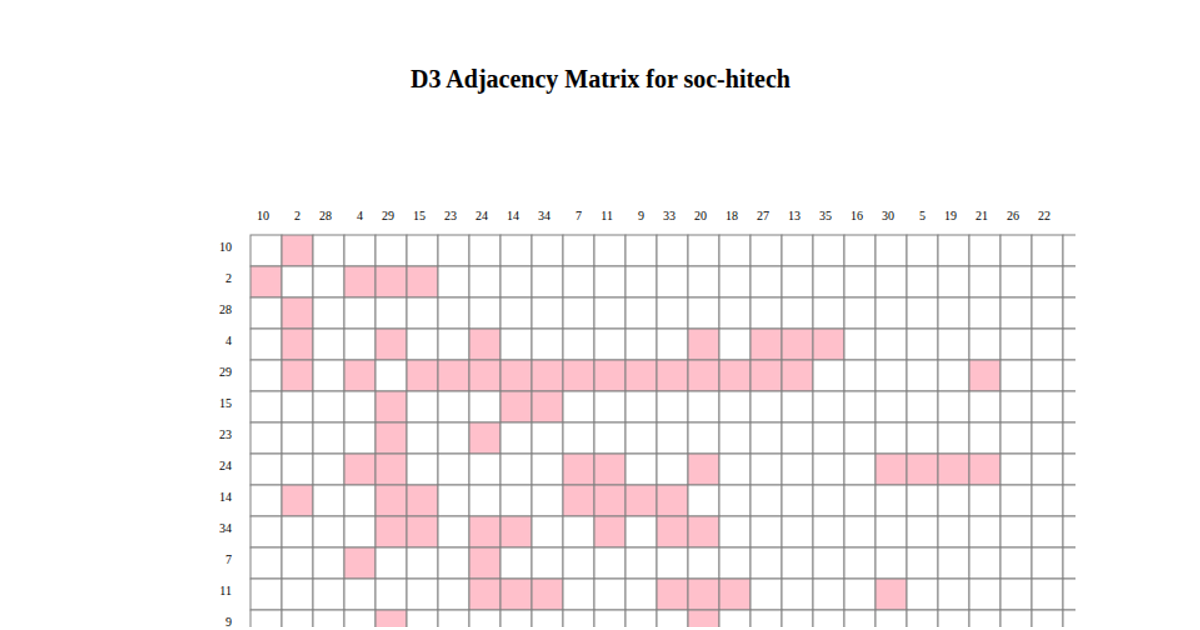
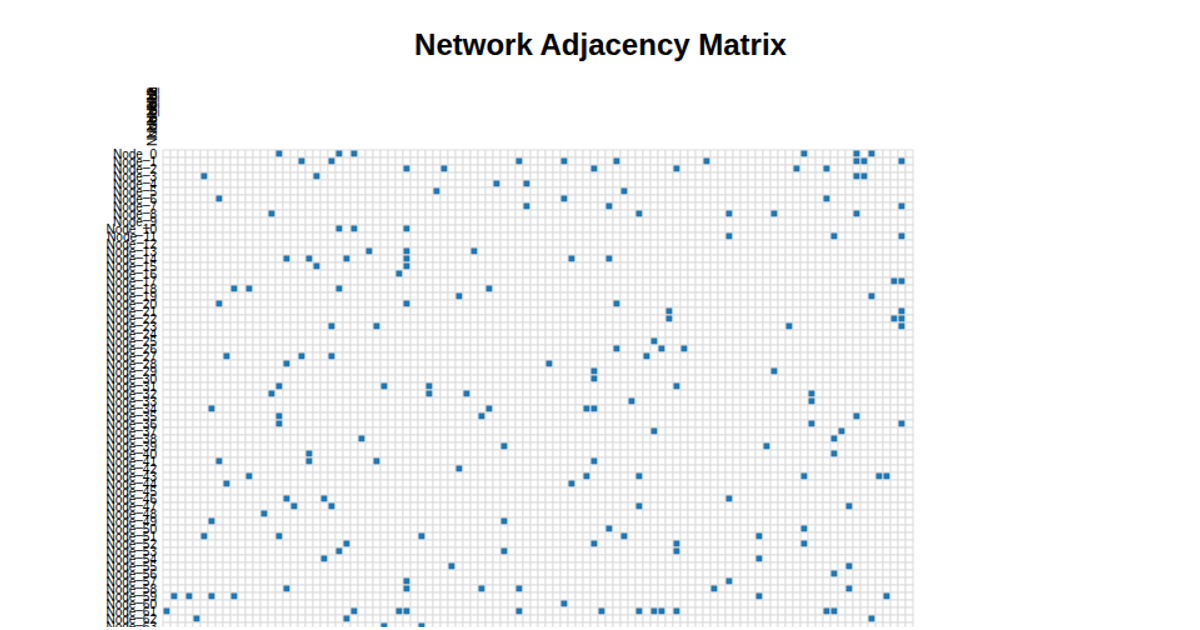
This adjacency matrix visualizes the Wikipedia Voter Dataset, showing connections between users as black cells on a white grid. Built with D3 v6 using SVG rendering, the code reads CSV data via `d3.csv`, constructs the matrix, and sorts node IDs numerically. Each cell renders as a `rect` with hover interactions that trigger a tooltip and highlight the cell in orange, while row and column labels display node identifiers.
AI-generated descriptionAn adjacency matrix depicting the Wikipedia Voter Dataset.
MIT Licensed



Comments
Sign in to join the discussion.