🌍 Public
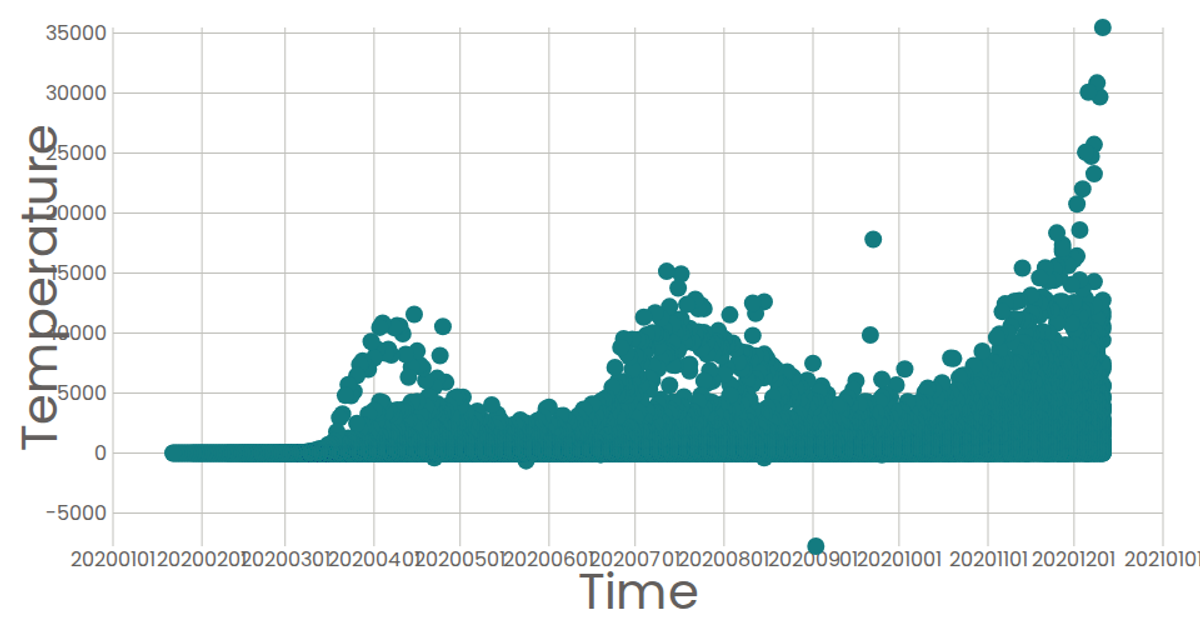
t4 scatterplot
This example visualizes the daily number of new COVID-19 cases worldwide, aggregated by date from a CSV dataset. It renders an SVG line chart with a time-scaled x-axis and a linear y-axis, using `d3.csv`, `d3.rollups` to sum cases by date, and `d3.line` to draw the path. The chart includes axis labels and a title, all styled with D3 v6.
AI-generated descriptionAn example showing the capabilities of VizHub:
- Loads D3 via UNPKG.
- Demonstrates use of
importfrom"d3". - Demonstrates use of
importfrom local ES6 modules.
MIT Licensed




Comments
Sign in to join the discussion.