🌍 Public
Fork of Fork of Fork of Fork of Hello VizHub
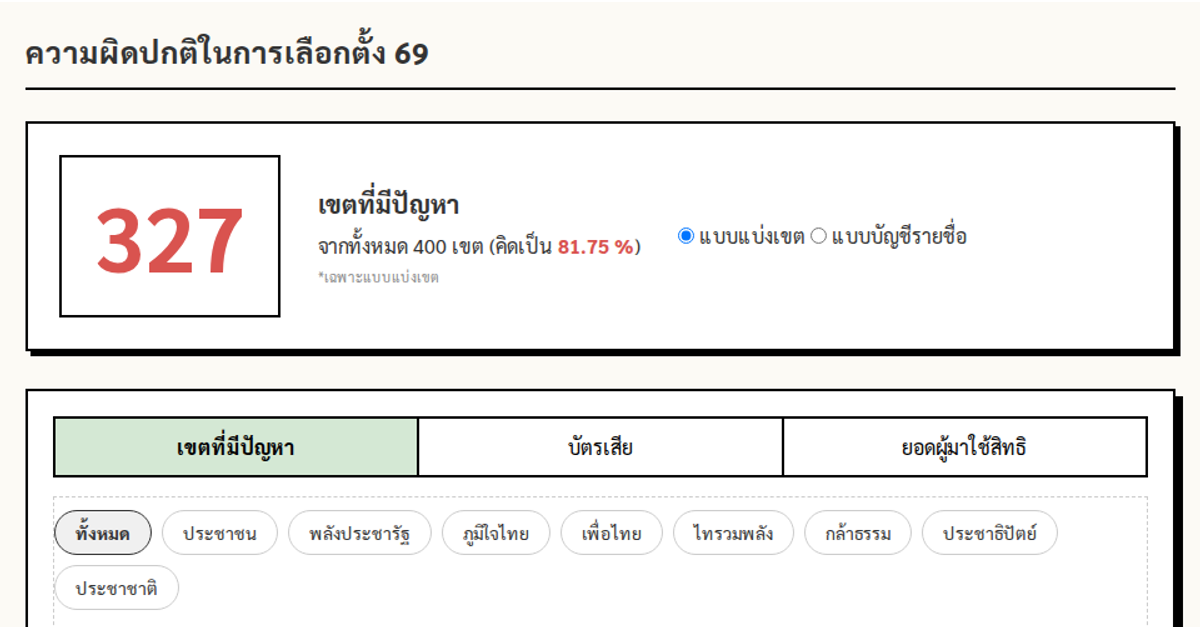
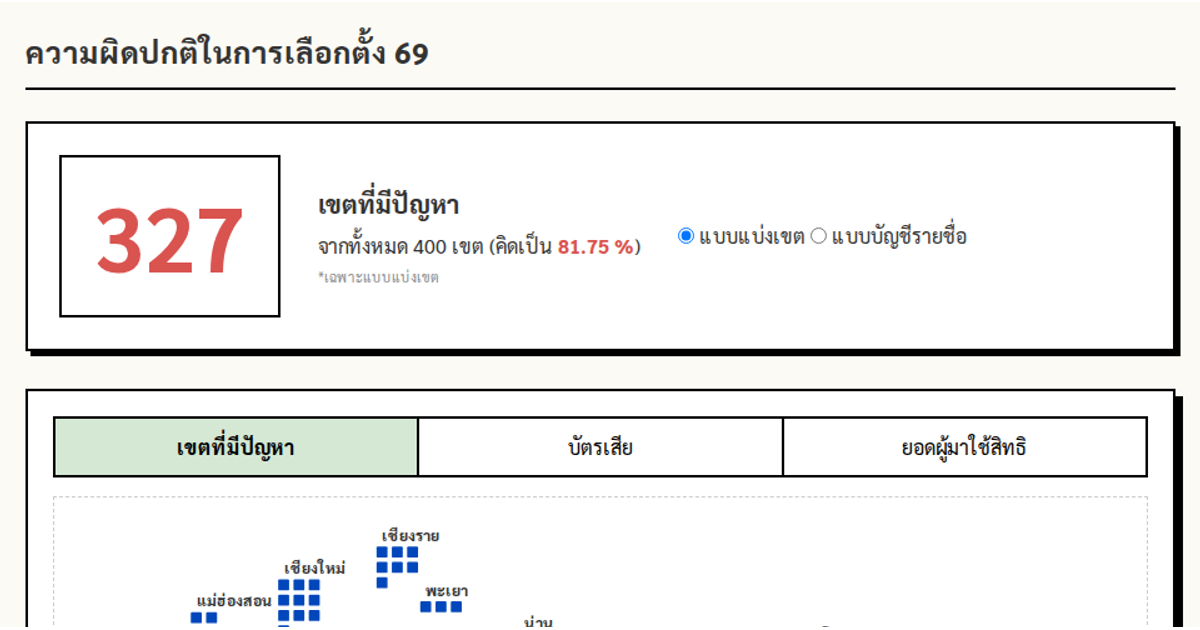
This interactive dashboard visualizes potential irregularities in the 69th Thai election across 400 districts, using CSV data covering district and party-list results. The interface combines a scrollable bar chart of problem counts, a donut chart showing winning party shares, a scatter plot correlating vote margin ratios with problem reports, and a spatial grid map. Built with D3 v7, the visualization features interactive radio buttons for election type, sortable bar sections, and tooltips, all styled with Sarabun typography and a responsive layout.
AI-generated descriptionMIT Licensed





Comments
Sign in to join the discussion.