🌍 Public
RC 007 pie chart
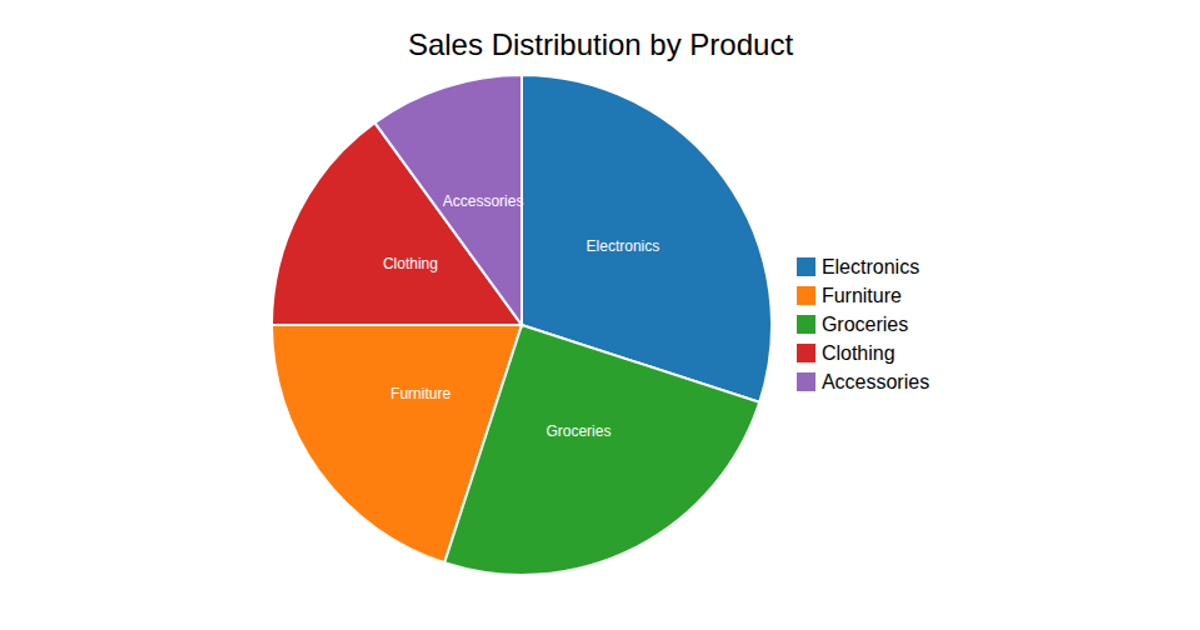
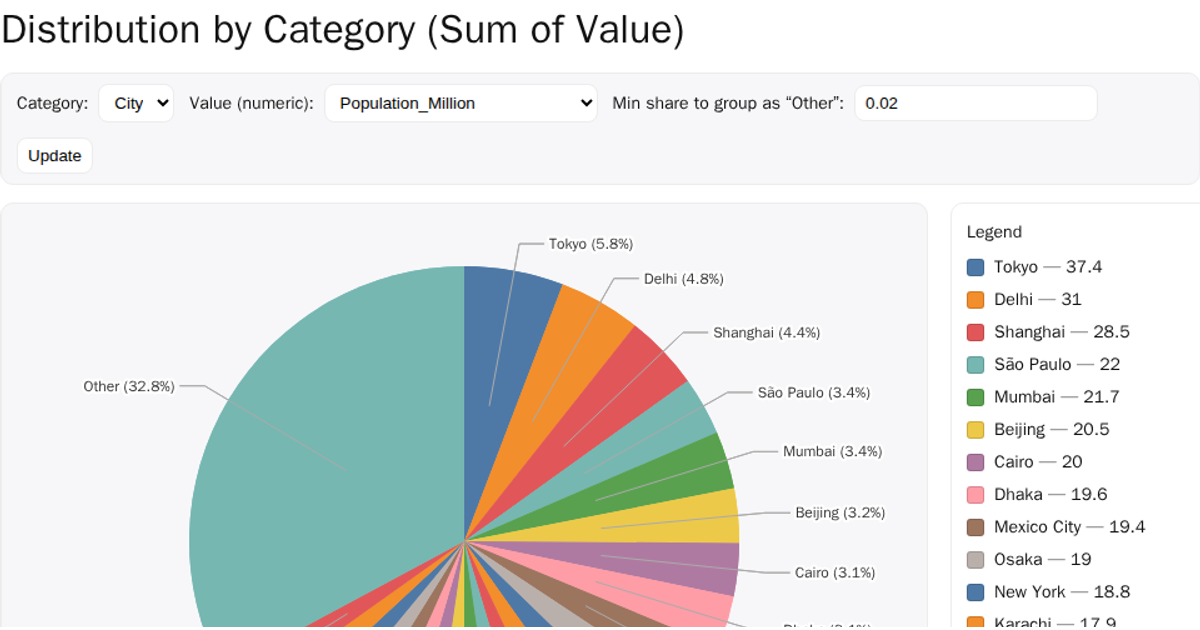
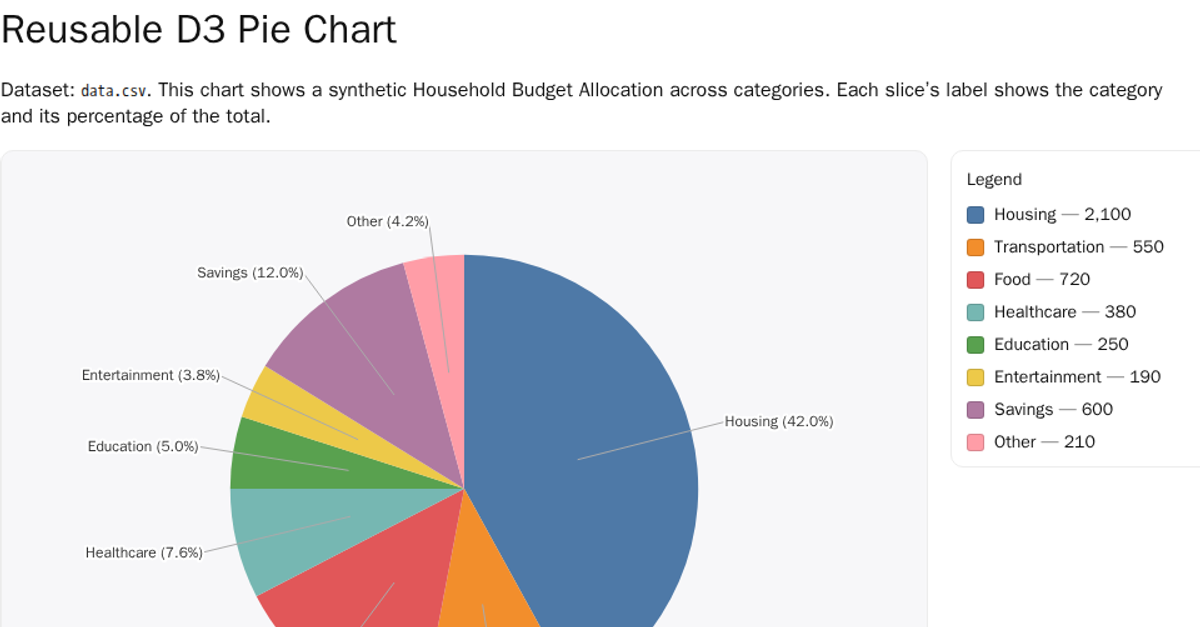
This visualization presents the latest quarter’s data on durable versus nondurable goods as two animated pie charts. Each slice’s size reflects its value, with labeled connector lines and tooltips showing exact figures and percentages. Built with D3 v7, the code uses `d3.pie`, `d3.arc`, and color scales from `d3.scaleOrdinal` to render and update the SVG paths, polyline labels, and animated transitions.
AI-generated descriptionMIT Licensed




Comments
Sign in to join the discussion.