🌍 Public
Lesson 6
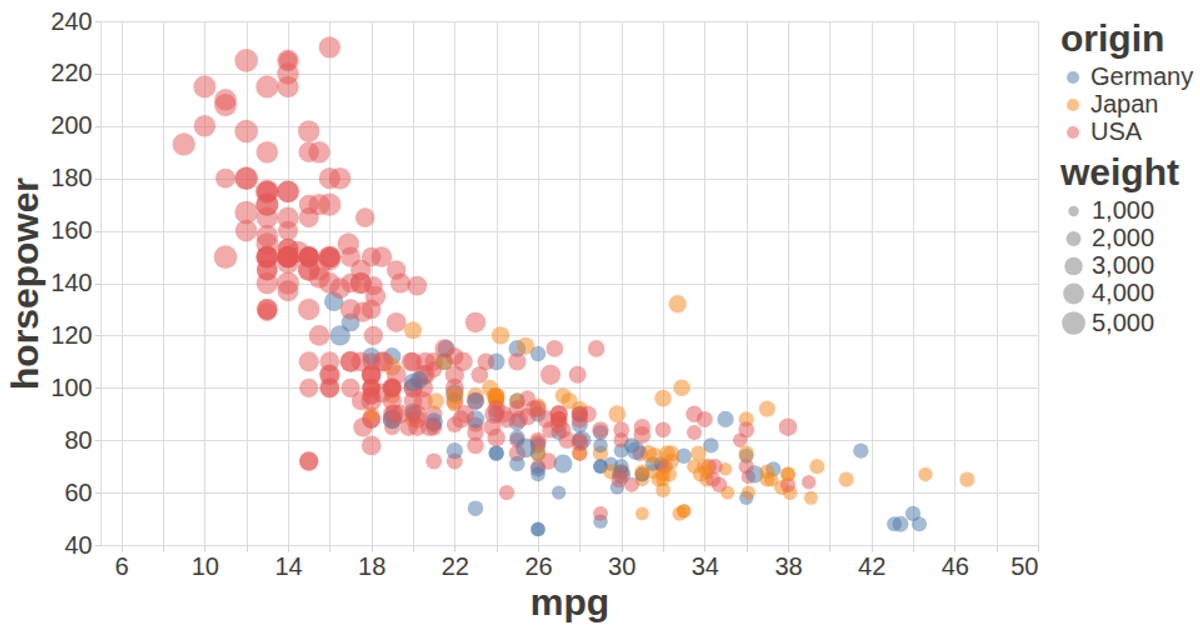
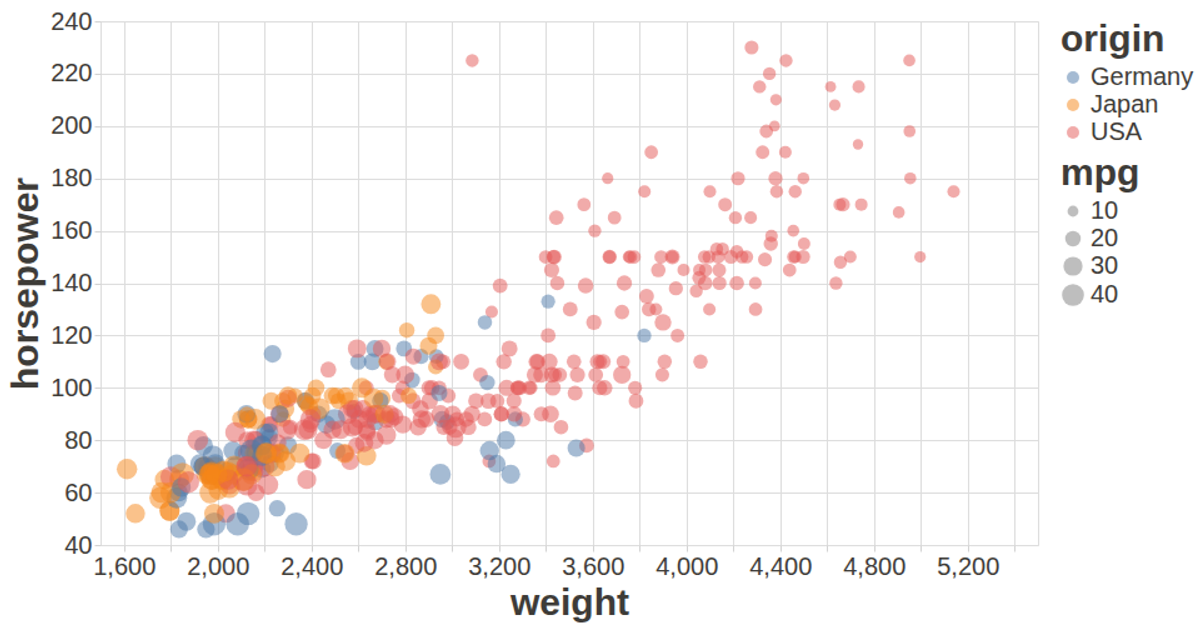
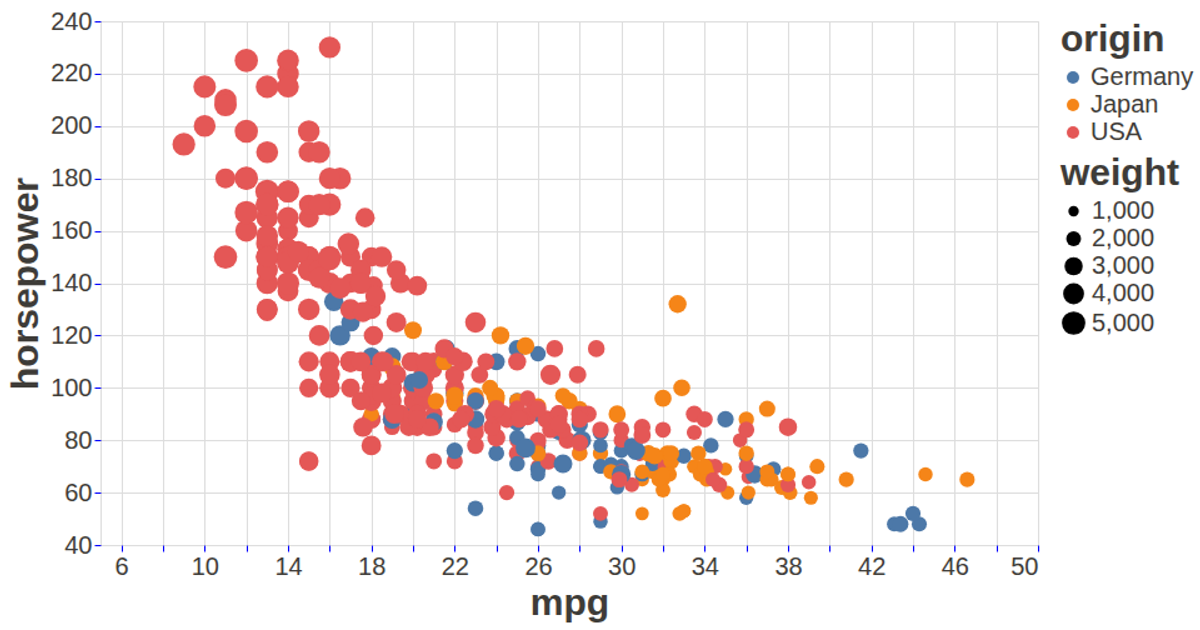
This visualization displays the relationship between vehicle weight, horsepower, and fuel efficiency using the auto-mpg dataset. A scatter plot maps weight on the x-axis and horsepower on the y-axis, while both the size and color of the circular marks encode miles per gallon, with tooltips revealing car names. It is built with the vega-lite-api, which wraps Vega-Lite and Vega, and loads data via d3.csv. The chart fills the browser window with a fit autosize and uses custom axis and label styling from a config object.
AI-generated descriptionLesson 6: A visualization constructed using the vega-lite-api.
MIT Licensed





Comments
Sign in to join the discussion.