🌍 Public
Random Number
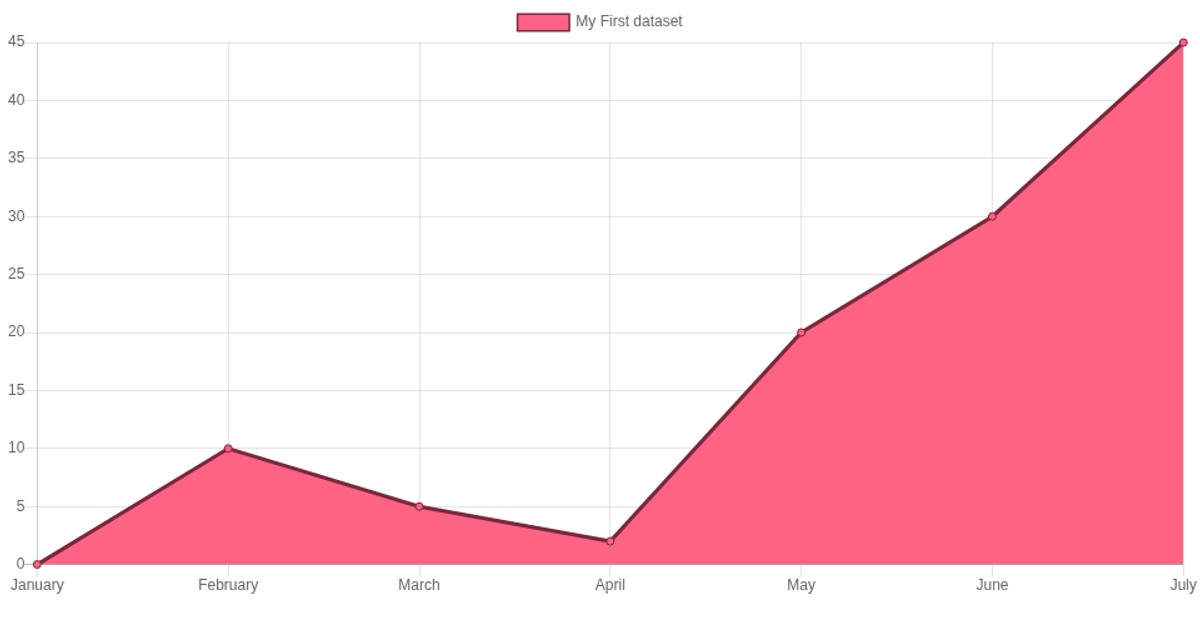
Two charts display monthly data for a single year. A bar chart and a line chart share the same twelve month labels on the x-axis, with each dataset containing a distinct set of numeric values. The page sets its title via JavaScript and uses the Chart.js library, loaded from a CDN, to render both canvases. The bar chart is drawn with a red background and border, while the line chart uses a red fill with a different blue border color. Both canvases are styled with a dark blue CSS border.
AI-generated descriptionMIT Licensed



Comments
Sign in to join the discussion.