🌍 Public
Fork of Scatter Plot with Menus
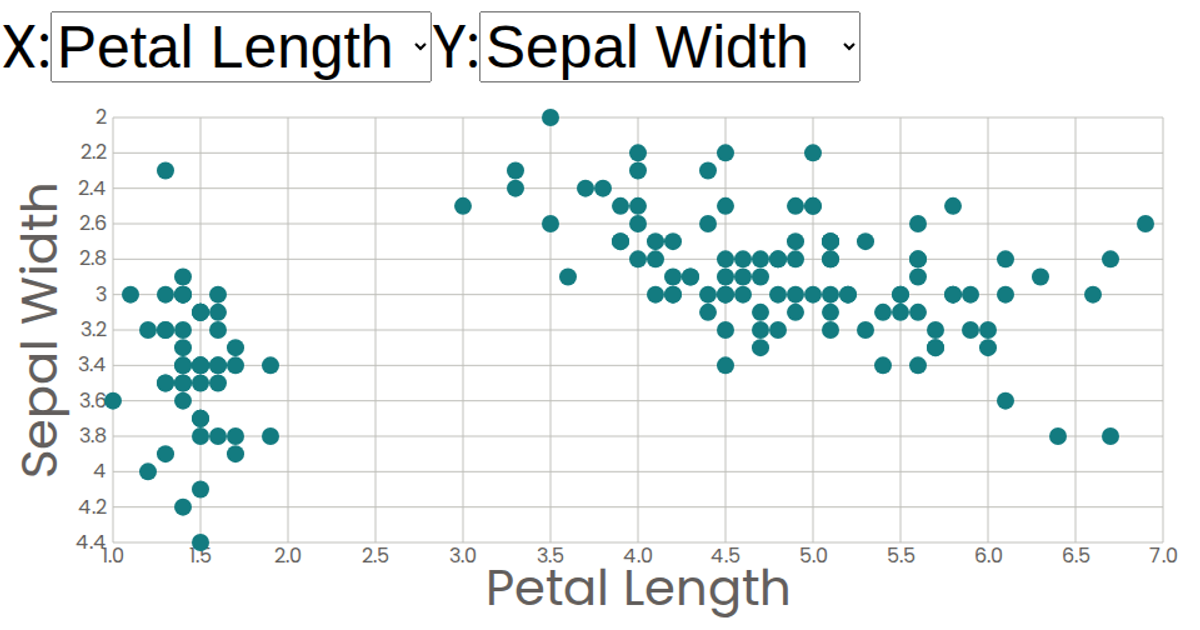
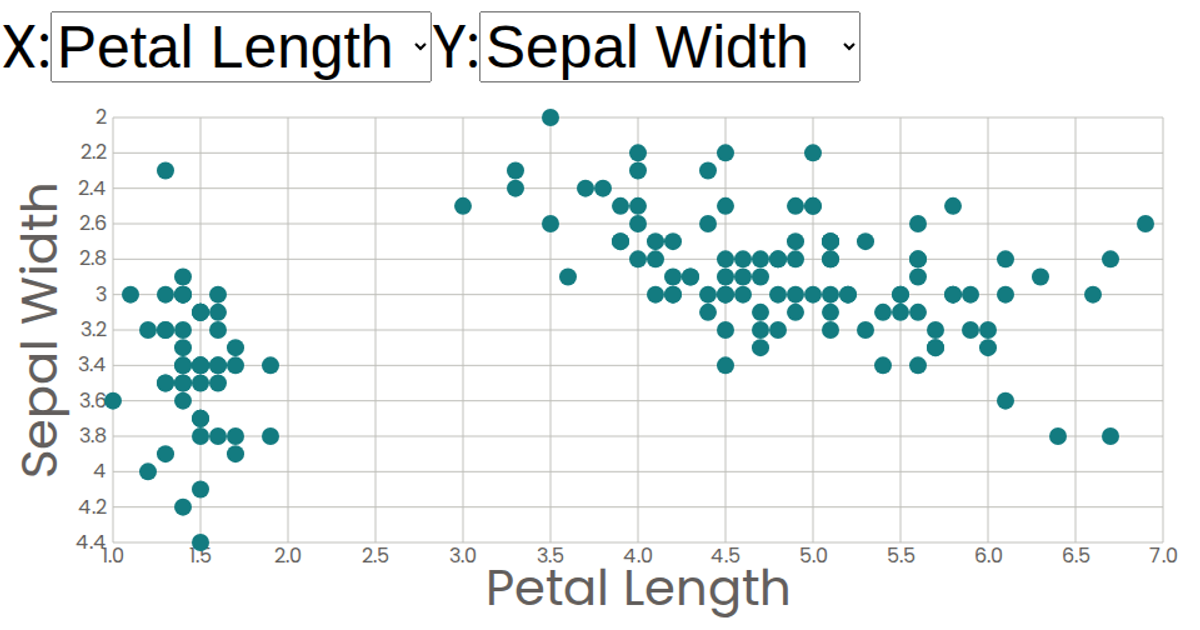
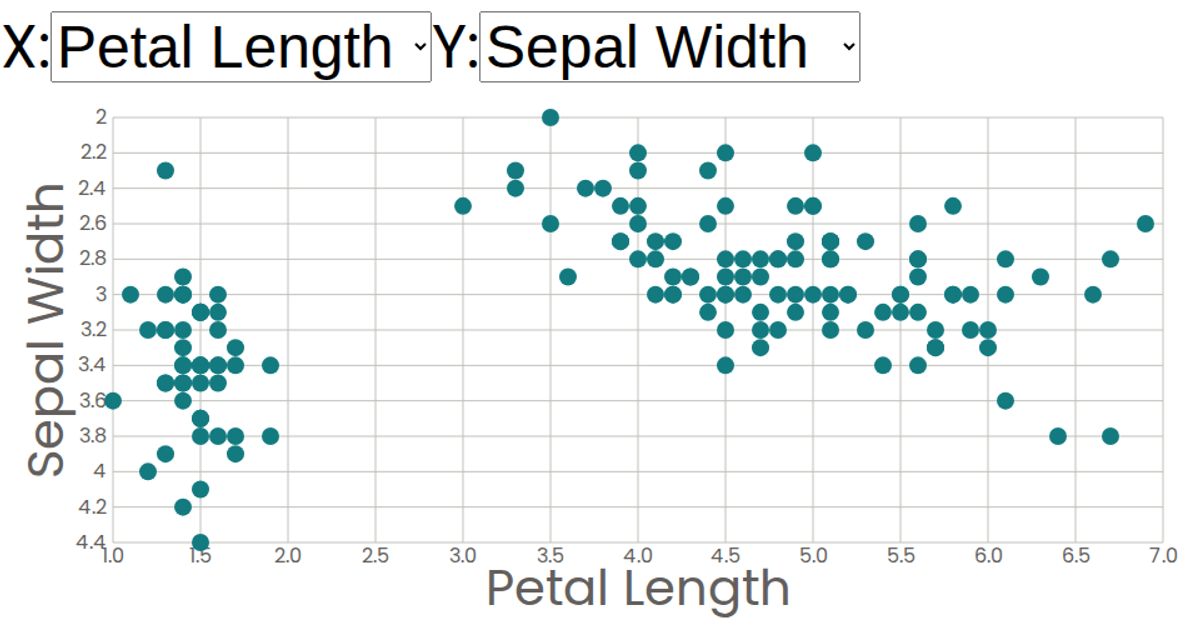
This interactive scatter plot visualizes the Iris Dataset, letting users explore the relationships between sepal and petal measurements across three flower species. The visualization presents a 2D projection of the multivariate dataset, with each flower represented as a circle positioned by its selected attributes on the x and y axes. Users can dynamically reassign which attribute controls each axis through dropdown menus, switching between sepal length, sepal width, petal length, and petal width measurements. The plot leverages React with d3.v5’s scaleLinear for axis scaling, with SVG rendering for circles and axis ticks.
AI-generated descriptionA scatter plot of The Iris Dataset.
MIT Licensed




Comments
Sign in to join the discussion.