🌍 Public
Fork of Sine Wave Circles
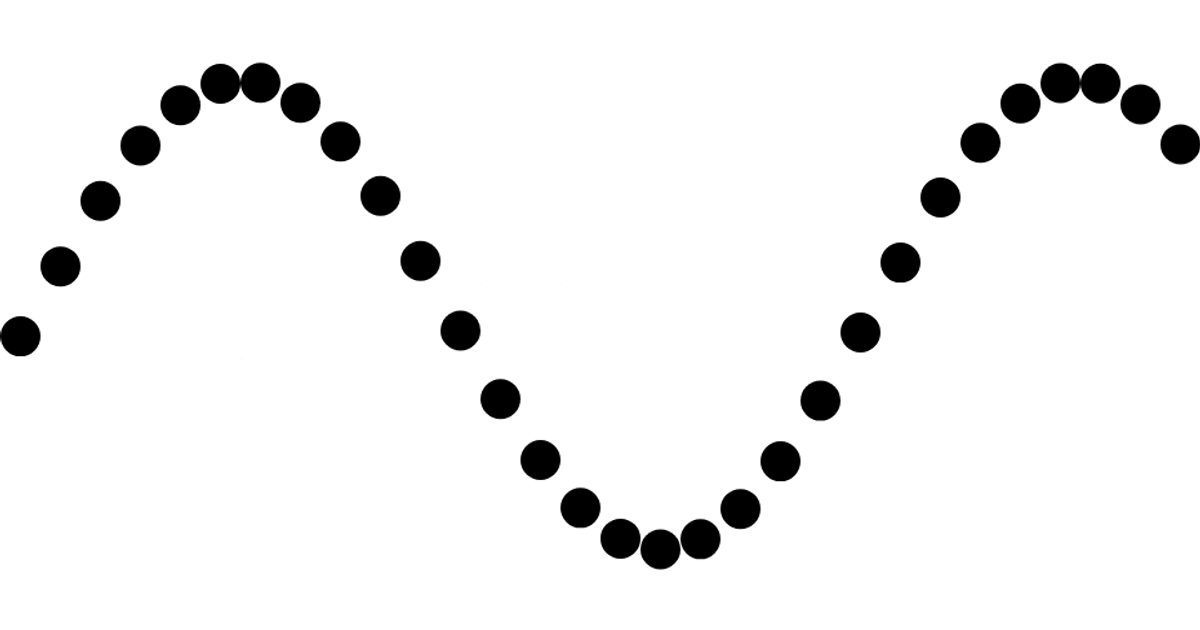
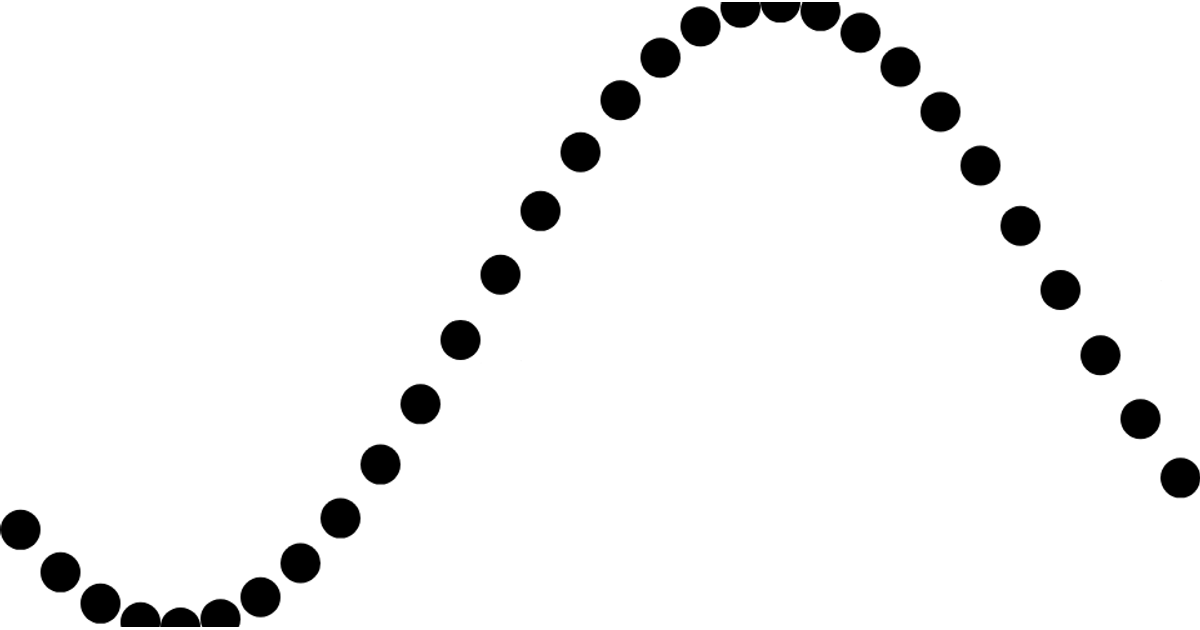
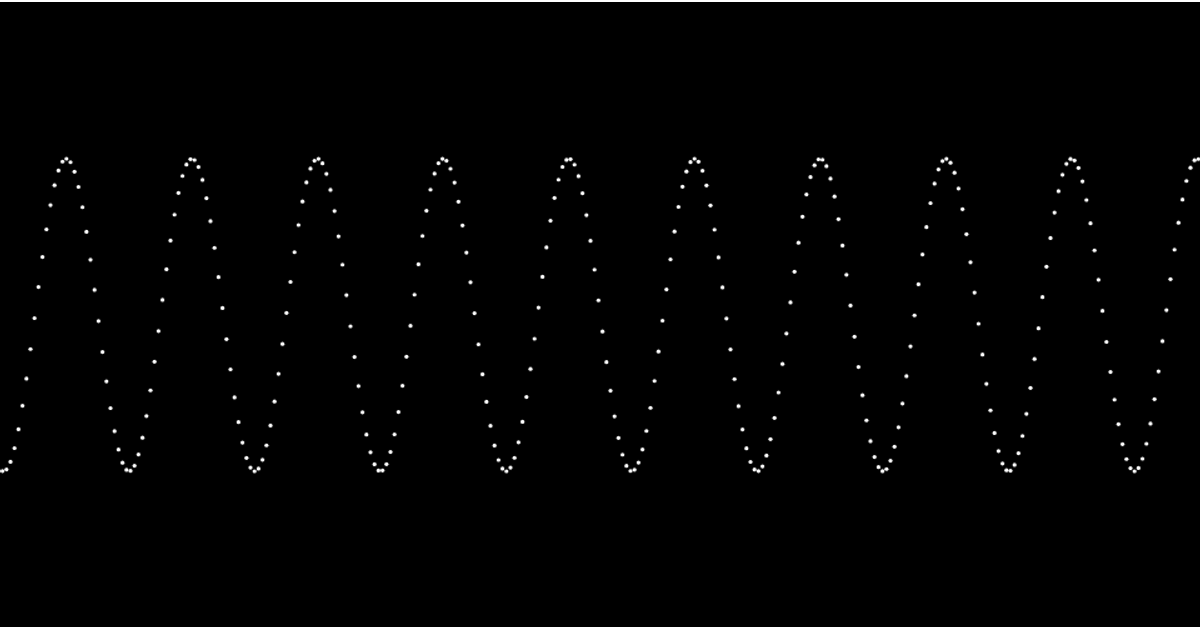
Thirty circles of equal radius form a horizontal row, each oscillating vertically with a phase offset to create a sine wave pattern across the screen. The animation runs continuously using a D3 timer, with each circle’s y-position computed from a sine function of time and its index. The visualization uses D3 v7’s `range` for data generation, `timer` for animation, and SVG circle elements positioned via `cx` and `cy` attributes. It is a direct port of the Math Sine Wave example from p5.js, adapted for the D3 framework.
AI-generated descriptionA D3 version of the Math Sine Wave P5.js example.
Ported to ES6 from an older version: bl.ocks.org: Sine Wave Circles with blockbuilder.org.
MIT Licensed





Comments
Sign in to join the discussion.