🌍 Public
3D Scatter Plot Sharanya Javvaji
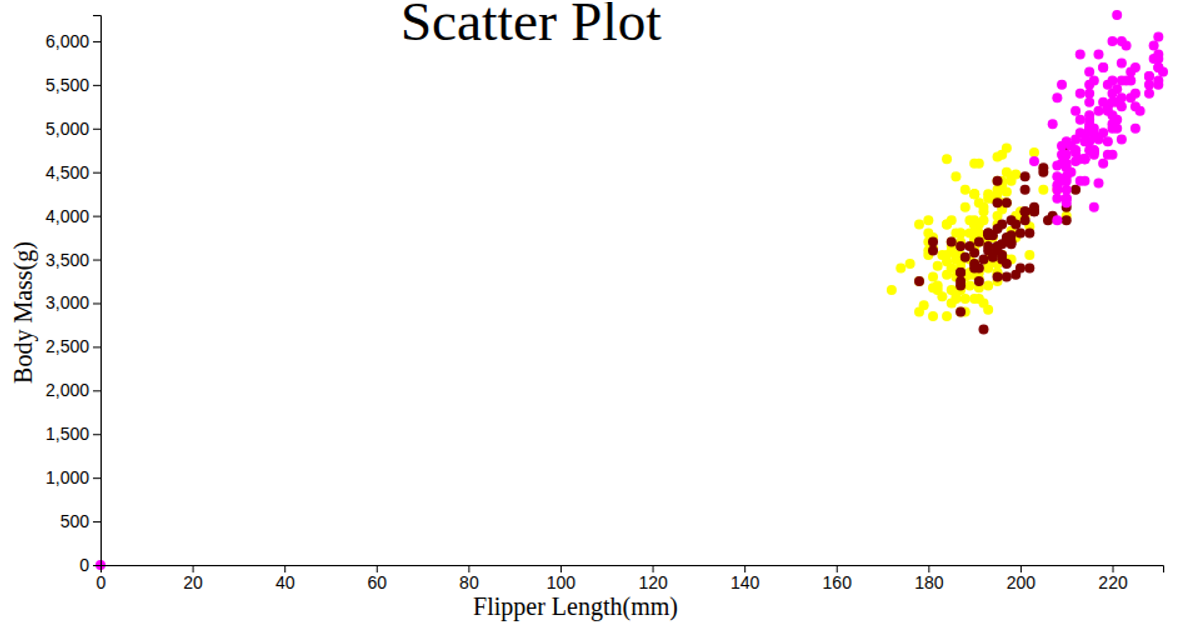
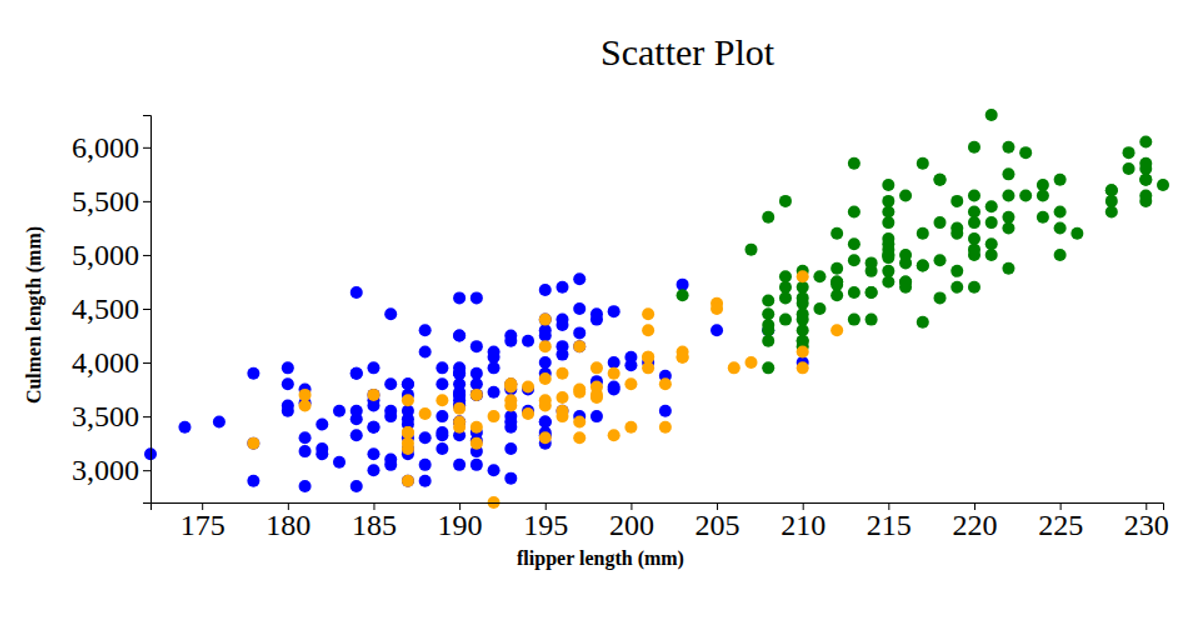
This 3D scatter plot visualizes the penguin dataset, showing the relationship between Flipper Length, Body Mass, and two different culmen measurements as separate series. The plot uses Plotly’s `scatter3d` trace type to render markers with varying opacity and size, with the chart embedded in a simple HTML page. The code loads data via `d3.csv` from a raw GitHub URL, then constructs traces and a layout with zero margins, finally calling `Plotly.newPlot` to display the interactive 3D visualization.
AI-generated descriptionA bare minimum HTML page demonstrating use of CSS and JavaScript.
See also React Starter.
MIT Licensed



Comments
Sign in to join the discussion.