🌍 Public
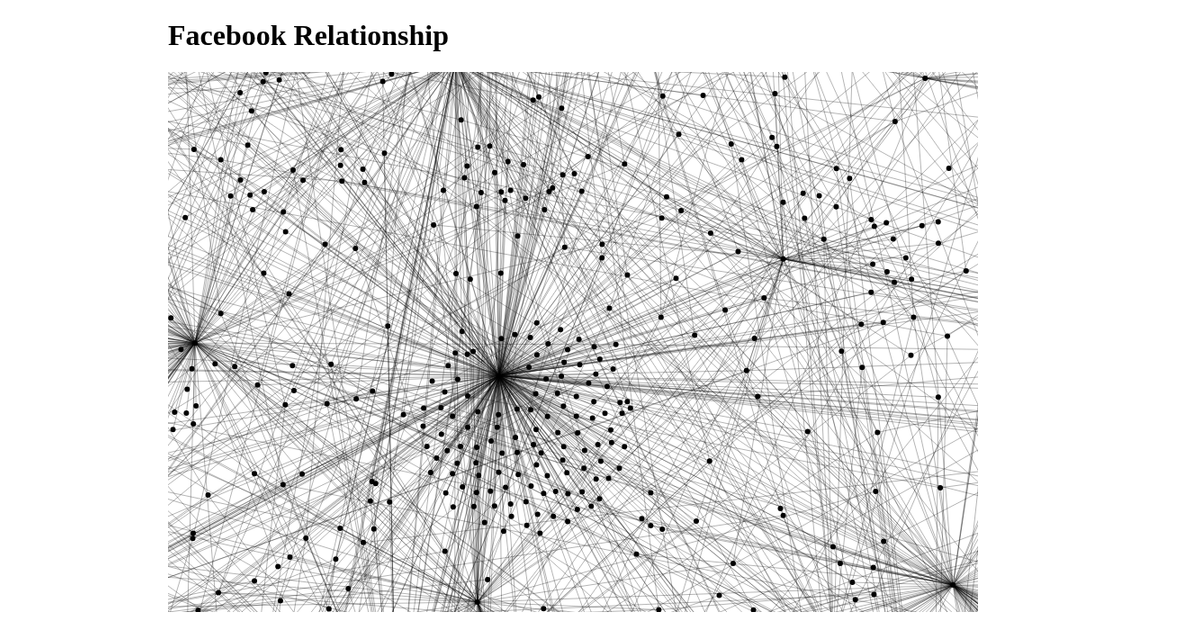
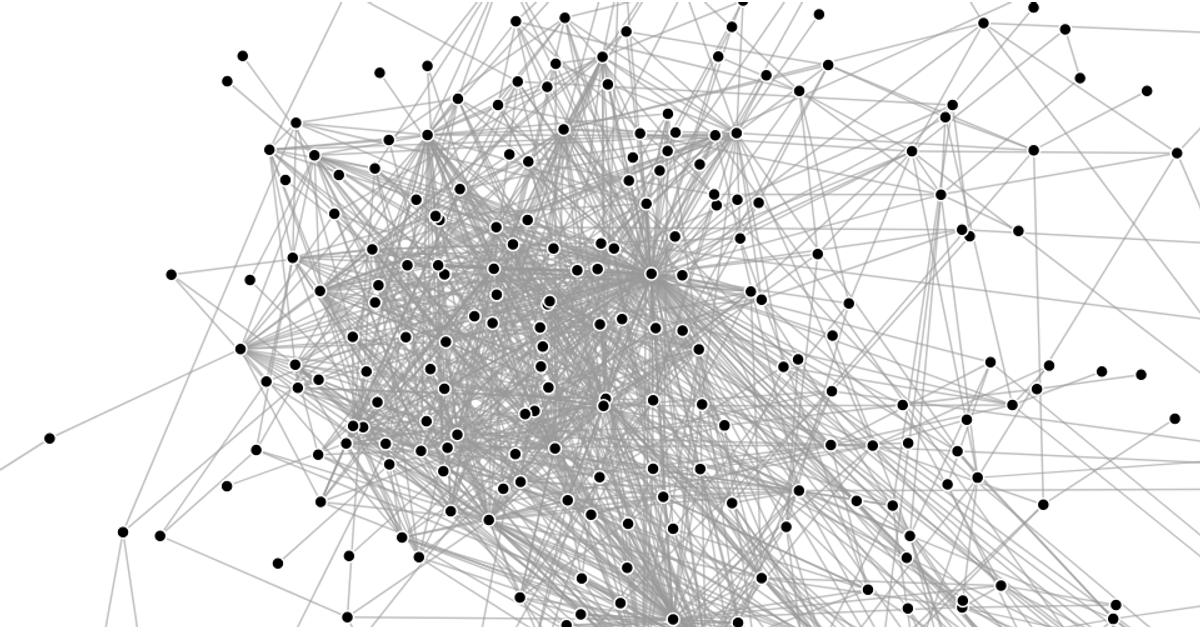
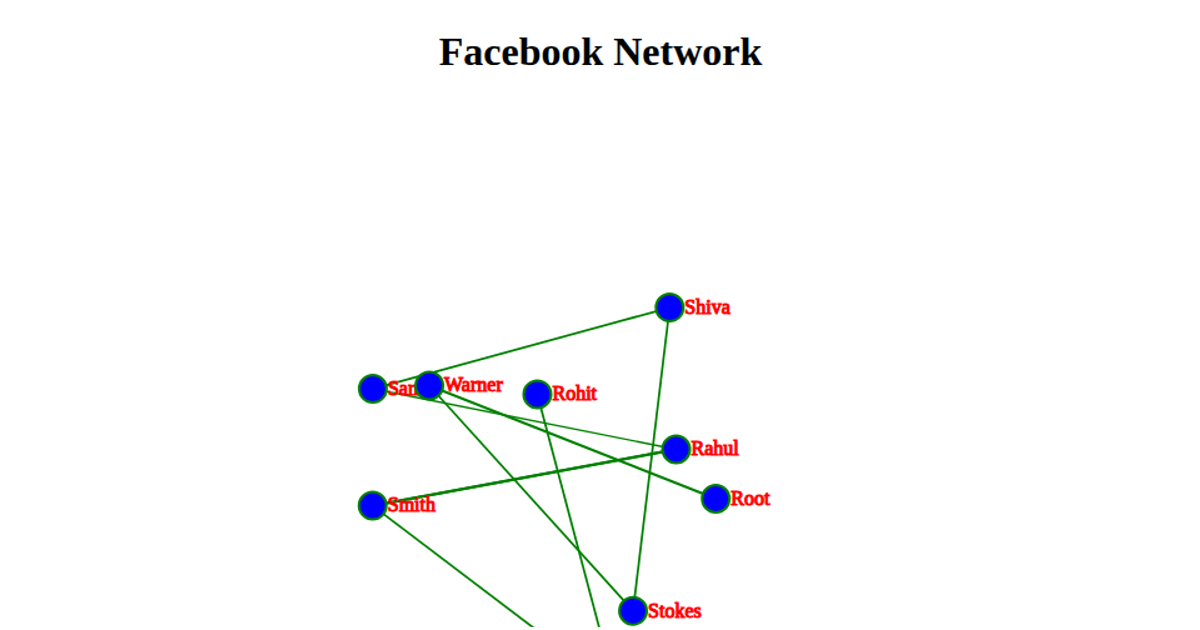
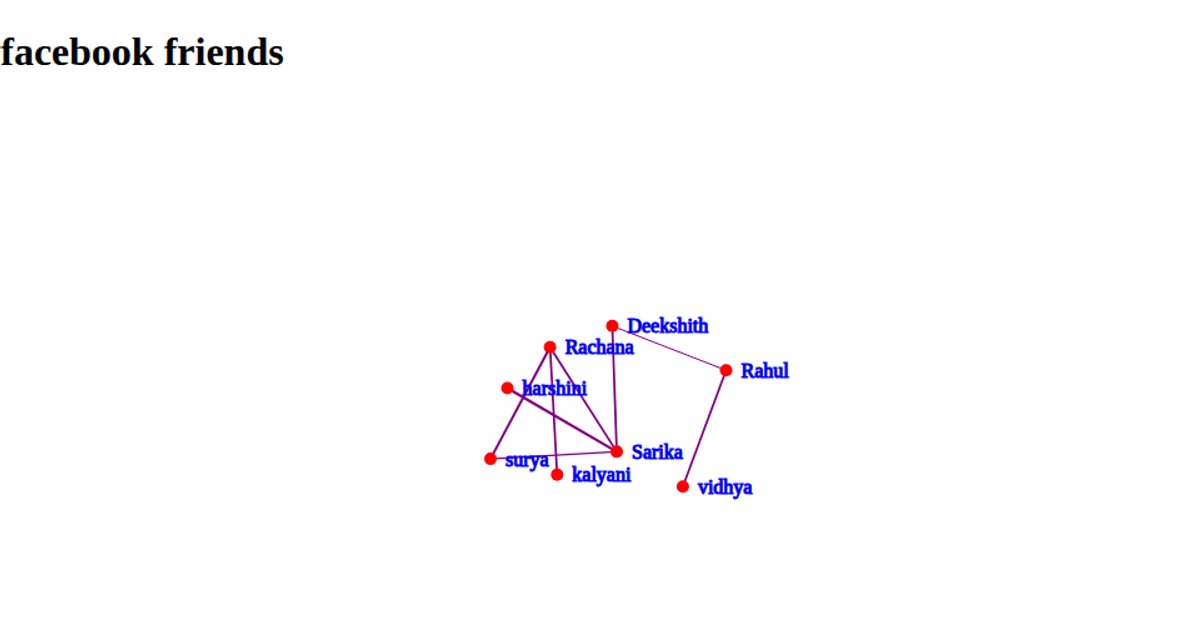
Viz of facebook relations
EELBOUNIAmine
Last edited May 8, 2021
Created on May 8, 2021
Forked from node-link diagrams v.s. adjacency matrix123
This example visualizes Facebook relationships using a combined force-directed graph and adjacency matrix. The left panel shows a network of nodes connected by links, built with `d3.forceSimulation`, while the right panel displays a grid representing the adjacency matrix, where each cell’s fill opacity reflects link weight. Clicking a node in the graph or a grid cell highlights the corresponding link in both views, using D3’s selection and event handling. Data comes from an external CSV edges file, and the visualization renders with SVG.
AI-generated descriptionMIT Licensed




Comments
Sign in to join the discussion.