🌍 Public
trace path
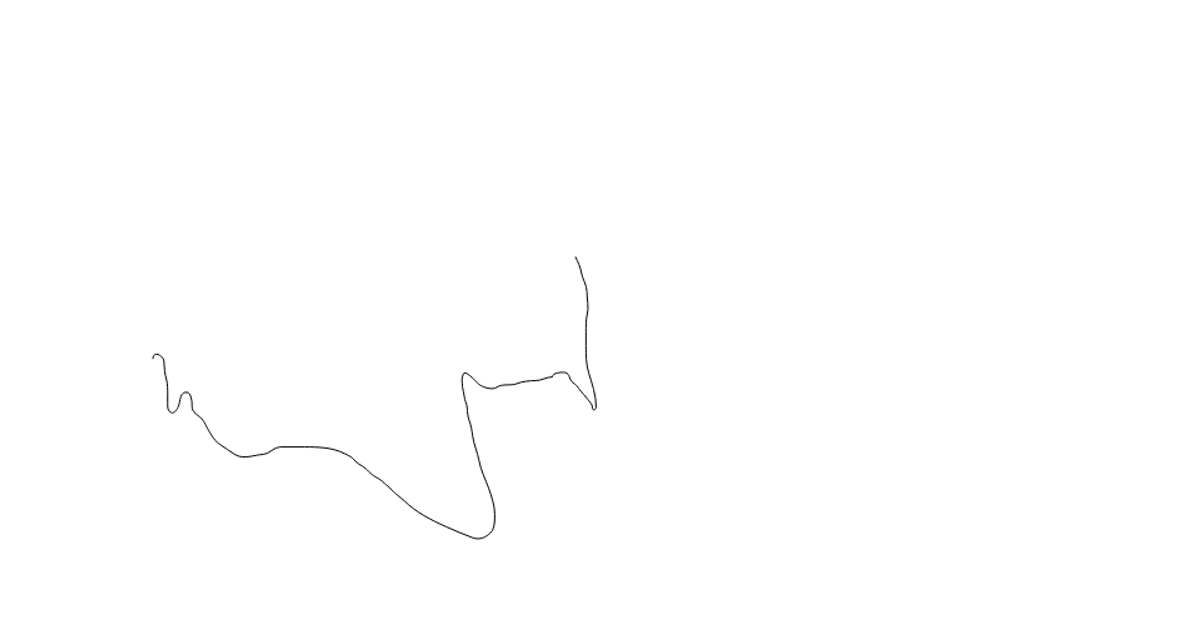
A looping sine curve is traced continuously by two animated segments: a solid orange stroke and a trailing grey echo. The SVG paths use the `stroke-dasharray` and `stroke-dashoffset` attributes, with `<animate>` elements driving the dash offset from 0 to 500 over five seconds. The path length is measured via `SVGPathElement.getTotalLength()` in a React hook, while the static grey reference path shows the full curve. The example uses React 18 and inline SVG, with the curve defined by cubic Bézier coordinates in the path data.
AI-generated descriptionReact Starter code.
MIT Licensed




Comments
Sign in to join the discussion.