🌍 Public
Bar Chart
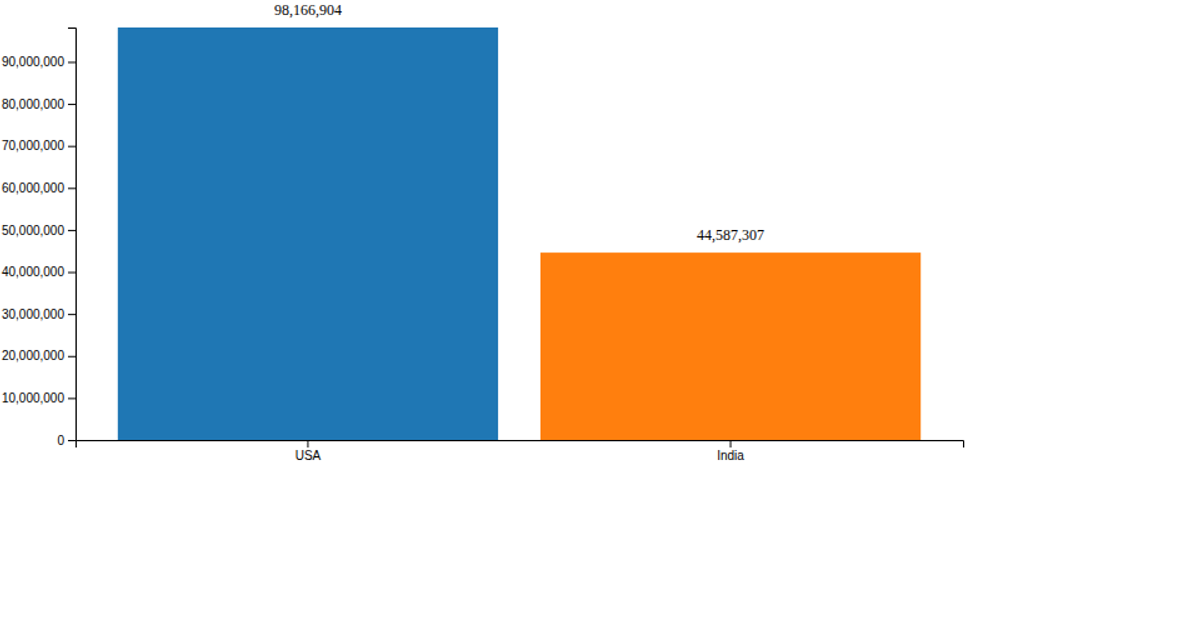
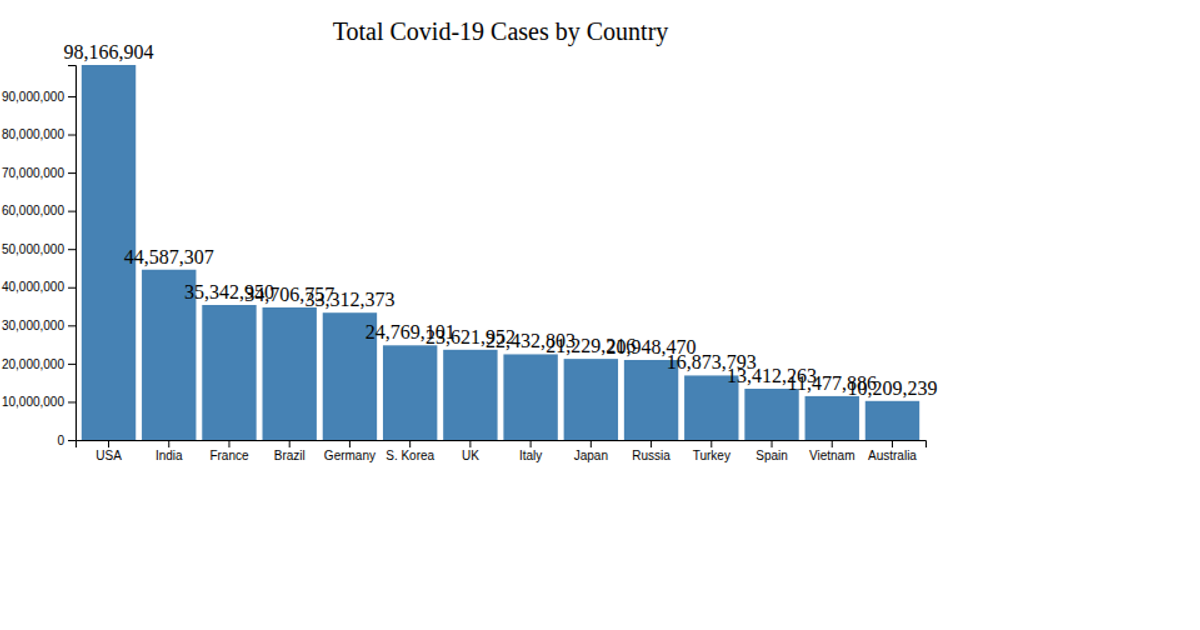
This bar chart visualizes the confirmed COVID-19 cases in Bangladesh for the first eight days of September 2020, sourced from a local CSV file. The chart uses D3 v6 within a React framework, rendering as an SVG. It employs `scaleLinear` for the y-axis, `scaleBand` for the categorical dates on the x-axis, and `axisLeft` and `axisBottom` to generate the axes. Steel-blue rectangles represent the case counts for each date.
AI-generated descriptionA bare minimum HTML page.
See also React Starter.
MIT Licensed






Comments
Sign in to join the discussion.