🌍 Public
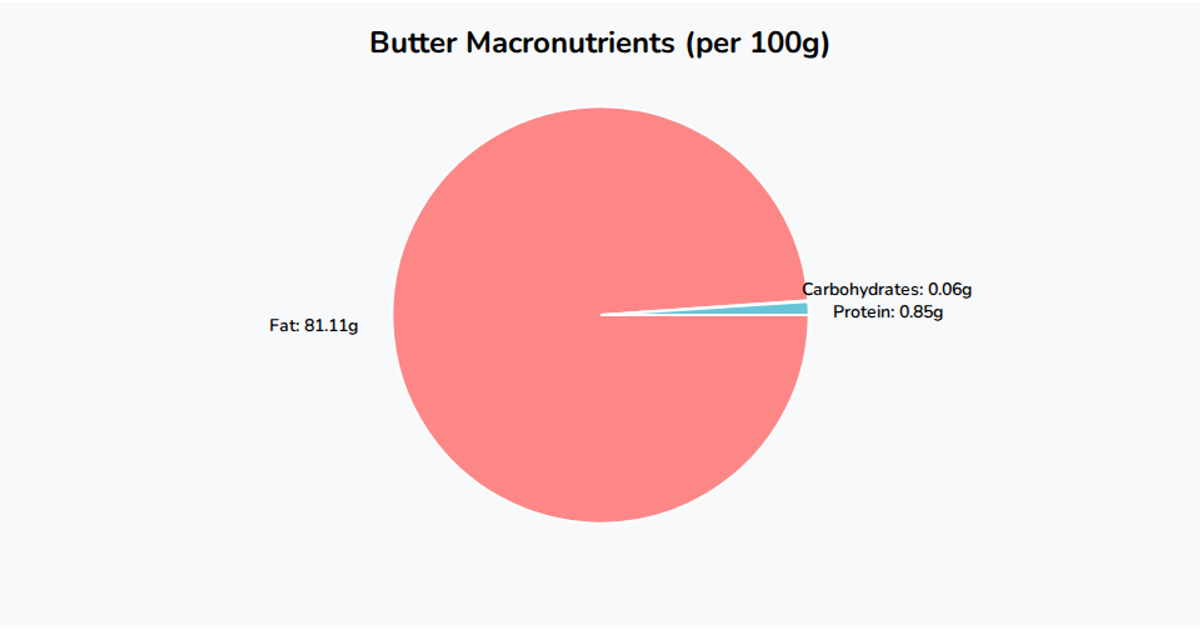
Fork of Butter Macronutrients
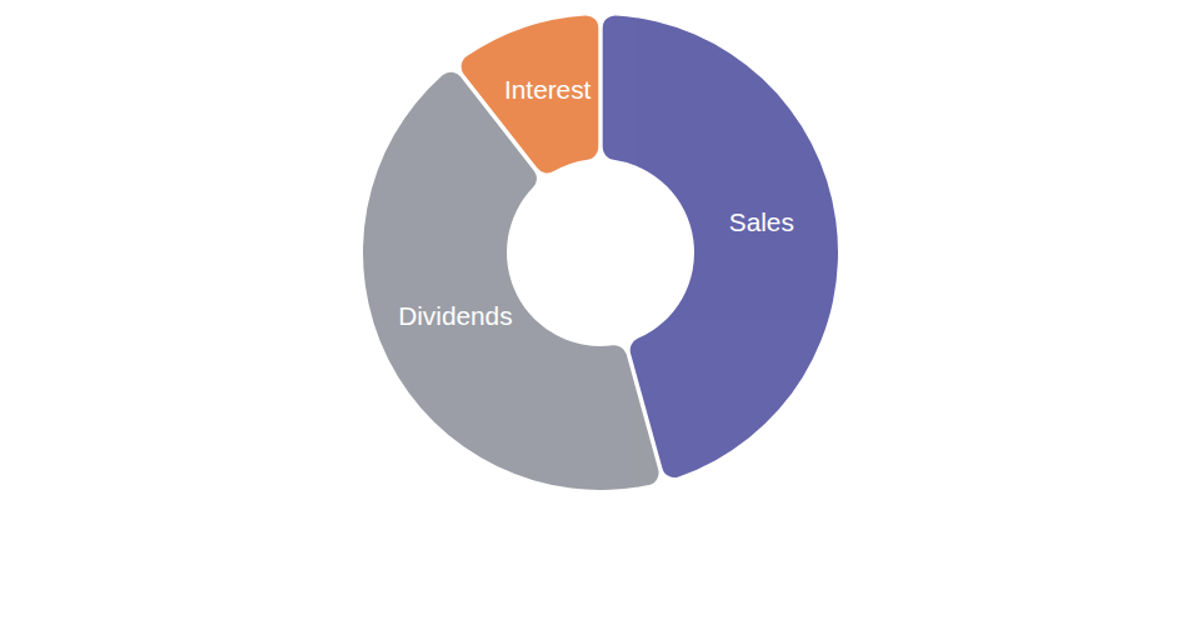
This interactive pie chart visualizes voting results from 602 total members, showing 275 cast votes with 270 agreeing, 5 disagreeing, and 327 not voting. Clicking an arc highlights that segment by increasing its opacity and stroke width. Built with D3 v7, the chart uses `d3.pie` and `d3.arc` generators to compute arc paths and label positions, rendered into an SVG with a unidirectional data flow architecture managing state updates.
AI-generated descriptionMIT Licensed




Comments
Sign in to join the discussion.