🌍 Public
Market Values based on the question
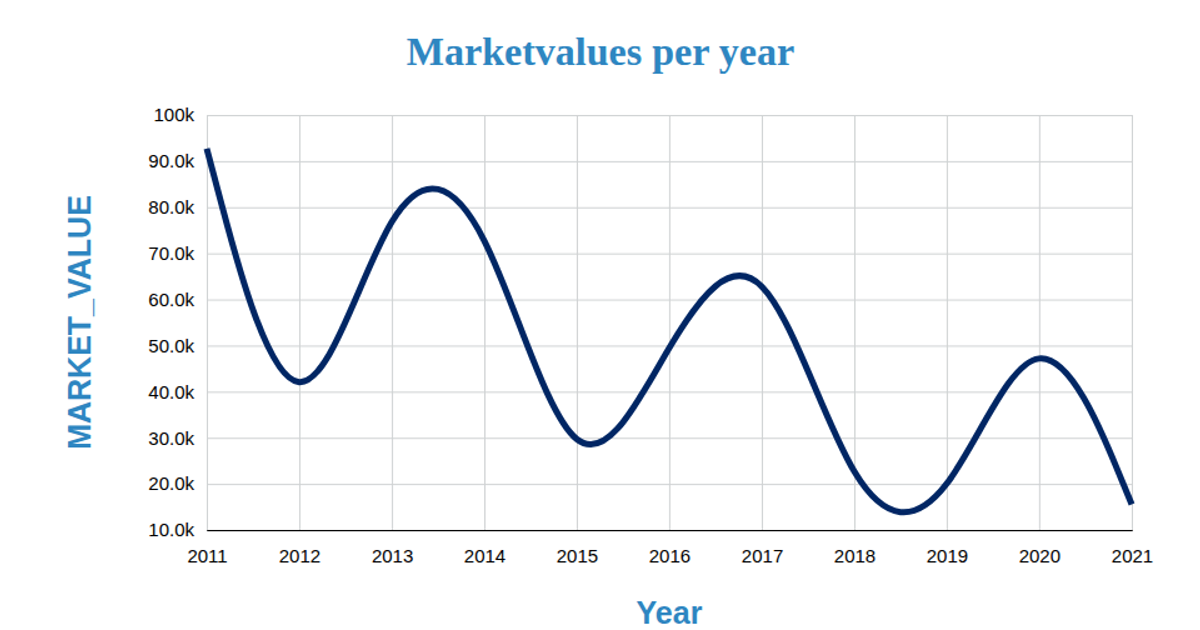
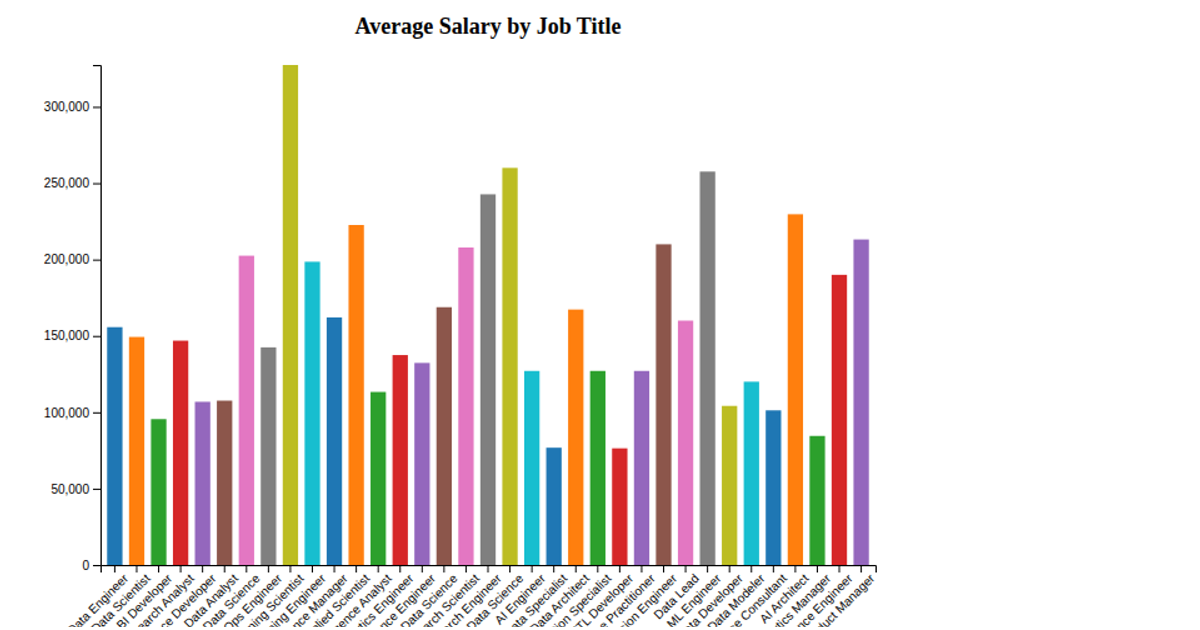
This visualization displays market values associated with various questions, rendered as an animated bar chart using D3 v5. The chart reads CSV data from a GitHub gist and encodes job titles along the y-axis and questions along the x-axis, with bars transitioning over one second. Users can sort the bars in ascending or descending order by market value using buttons. The implementation leverages D3's scaleBand, scaleLinear, axisLeft, axisBottom, and transitions, with SVG output and a tooltip that appears on mouseover.
AI-generated descriptionAn example showing the capabilities of VizHub:
- Loads D3 via UNPKG.
- Demonstrates use of
importfrom"d3". - Demonstrates use of
importfrom local ES6 modules.
MIT Licensed




Comments
Sign in to join the discussion.