🌍 Public
Fork of My Rank on HackerRank
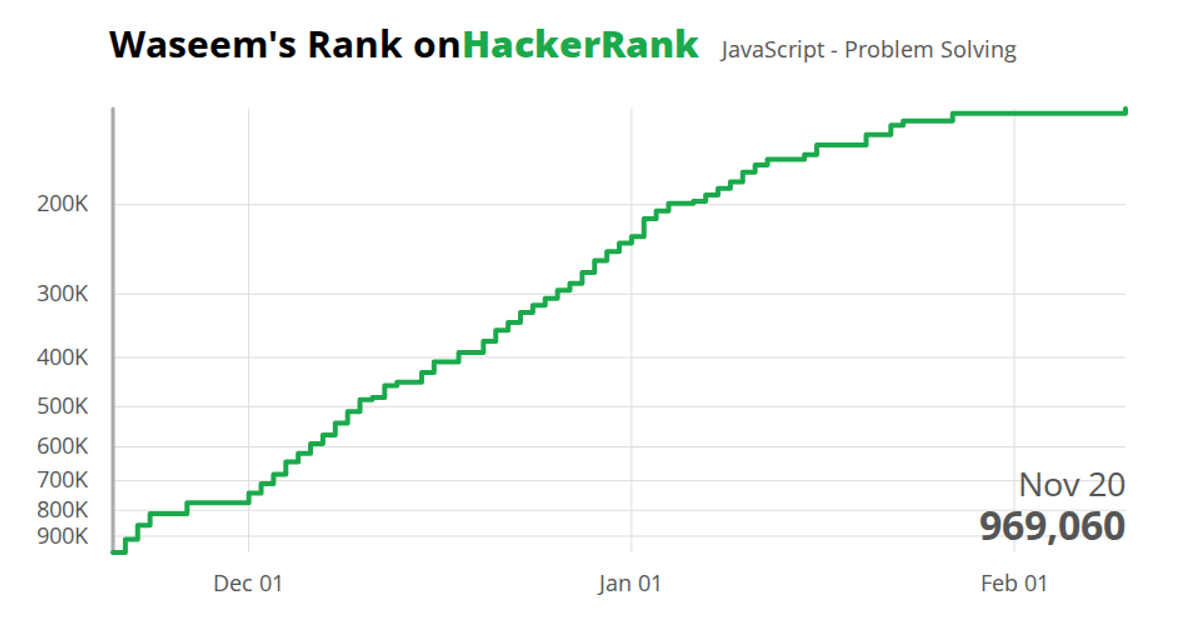
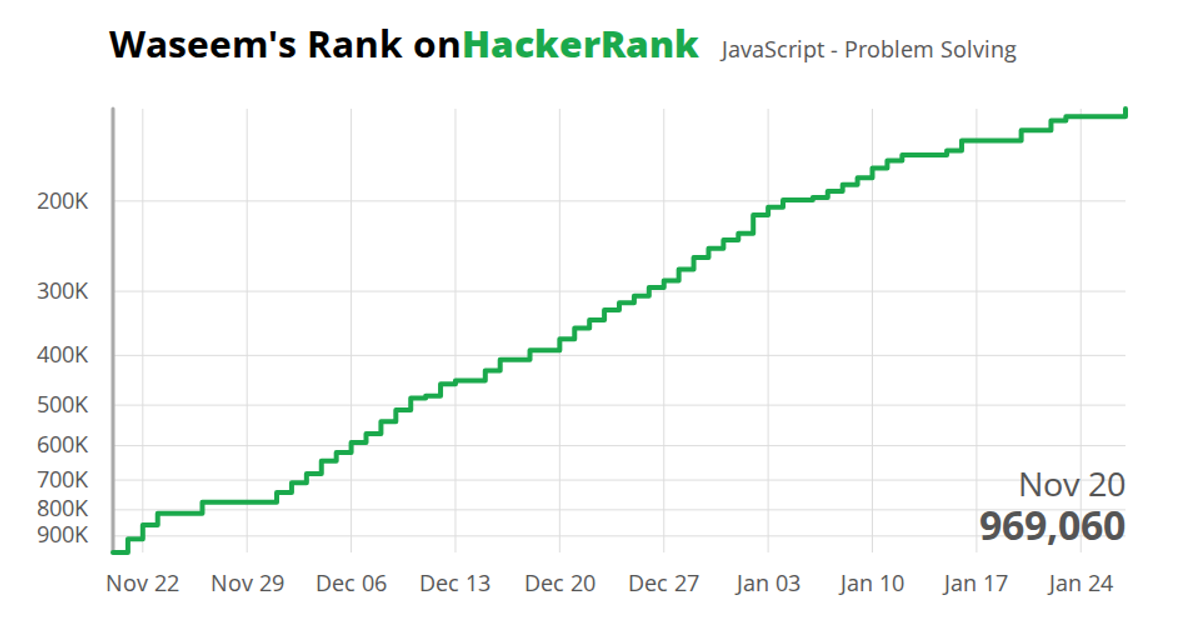
This visualization tracks the author’s HackerRank ranking over time as they solve JavaScript algorithm problems, showing a steady improvement from around 969,000 to 137,000. The line chart uses a step-after curve to emphasize discrete progress, with a logarithmic y-scale and tooltips that display exact ranks on hover. Built with React and D3 v6, it uses scaleTime, scaleLog, and extent for scaling, while axis components generate ticks and gridlines. The interactive tooltip responds to mouse movement by snapping to the nearest data point.
AI-generated descriptionA visualization that tracks my ranking as I solve JavaScript algorithm problems on HackerRank... Just for fun!
MIT Licensed



Comments
Sign in to join the discussion.