🌍 Public
The Barchart Clustered
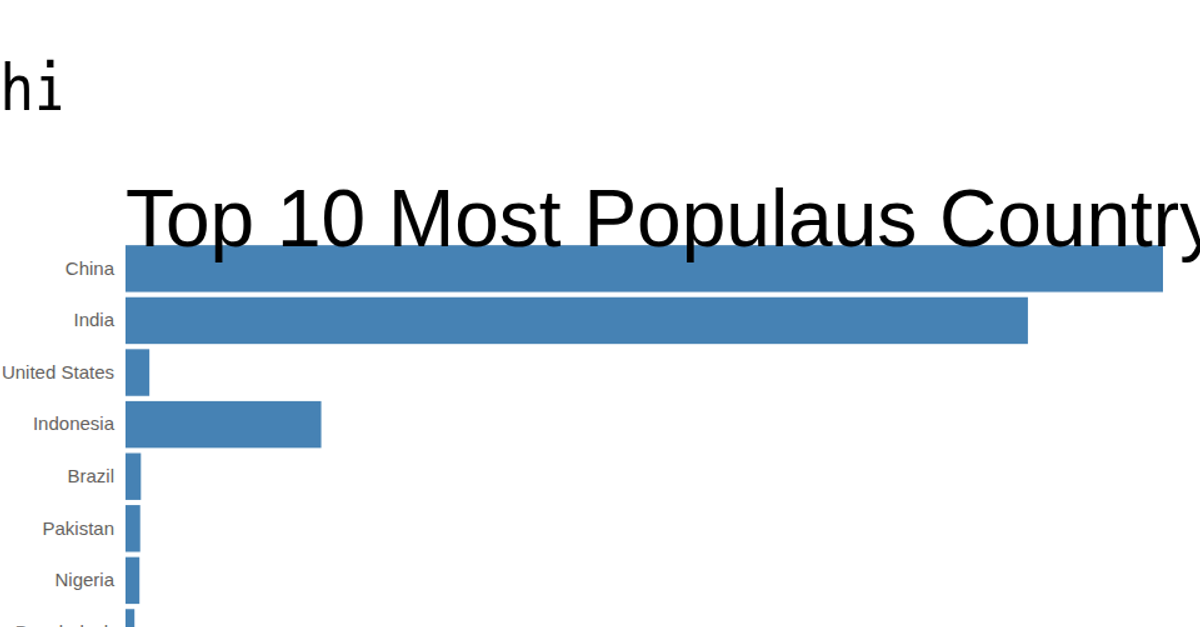
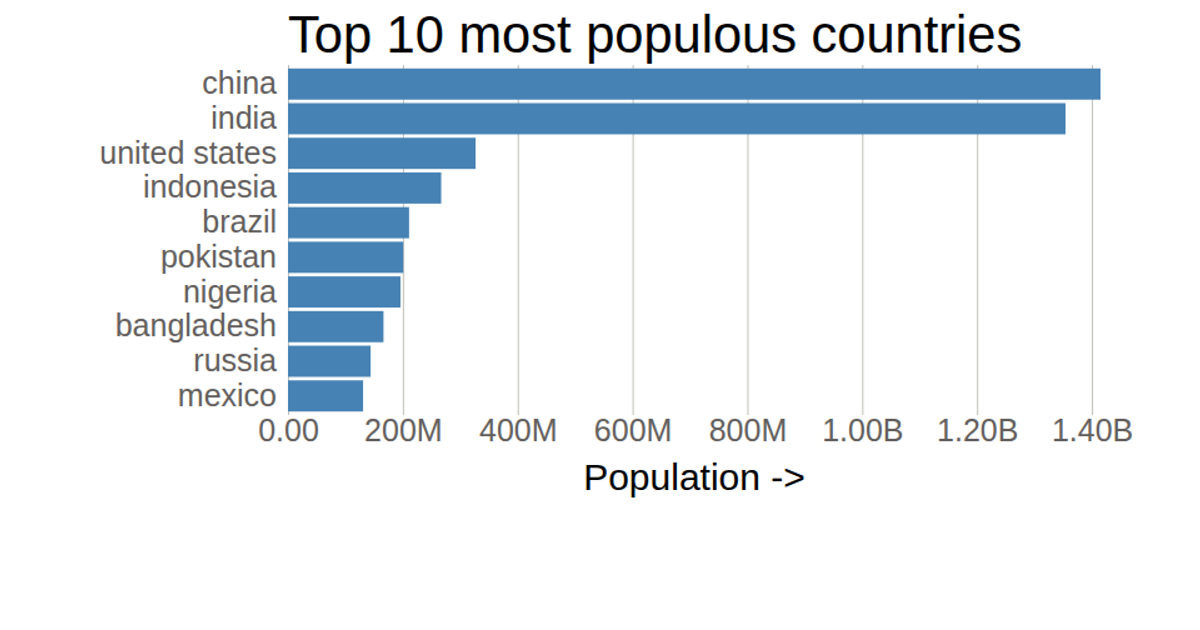
This example shows the population of the top 10 most populous countries using a horizontal bar chart. The bars are rendered as SVG rectangles, with the country names on the y-axis and population values on the x-axis. The chart uses D3 v5 APIs like `scaleLinear`, `scaleBand`, `axisLeft`, `axisBottom`, and `select` to build and style the visualization. Data is loaded from a local CSV file, and grid lines are drawn with a light gray color.
AI-generated descriptionMIT Licensed




Comments
Sign in to join the discussion.