🌍 Public
1963 UPW Data Viz 1.0
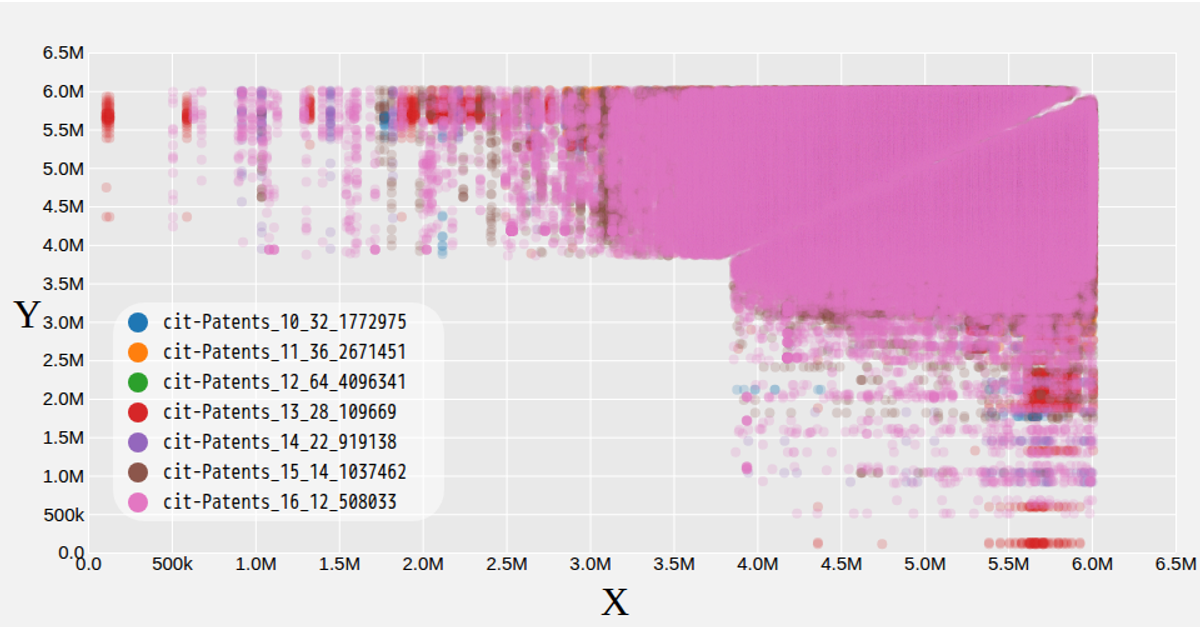
This interactive scatterplot explores the University of the Philippines Week 1963 dataset, allowing users to compare numeric attributes by selecting X and Y axes from dropdown menus. The visualization displays each data point as a colored circle, with hues representing the Topic category and a color legend explaining the mapping. Built with React and D3 v5, the chart uses scales and axes generated by `scaleLinear`, `scaleOrdinal`, `scalePoint`, and custom Axis components, rendering SVG marks with native tooltips.
AI-generated descriptionA program that loads and visualizes some data
MIT Licensed






Comments
Sign in to join the discussion.