🌍 Public
Dataflow of World Countries Tree
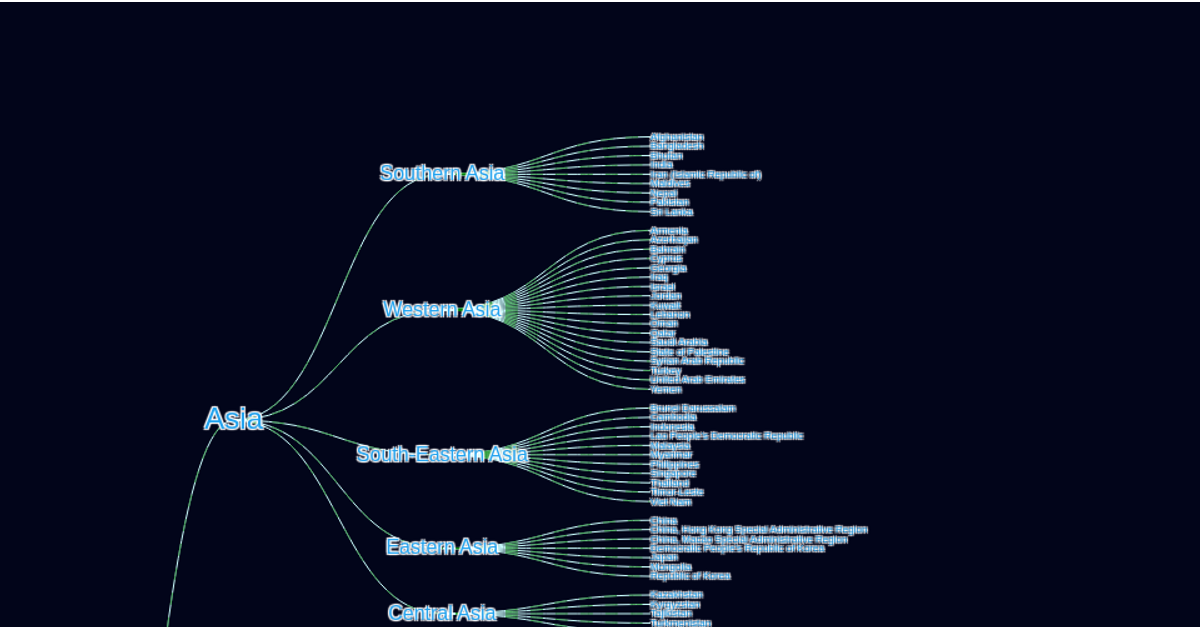
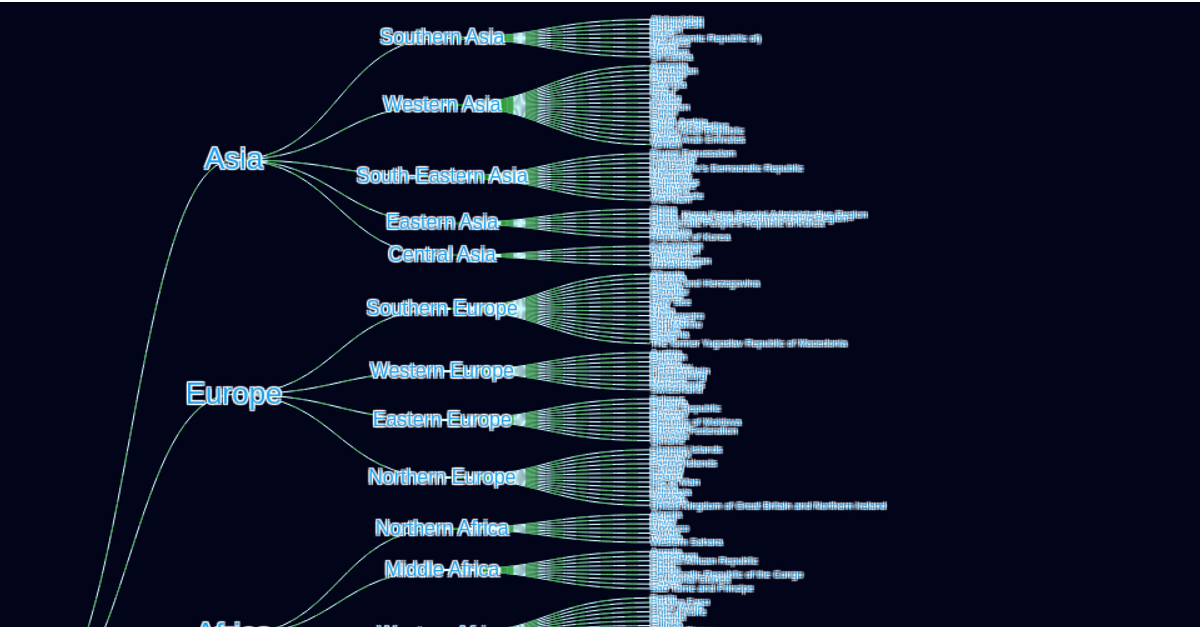
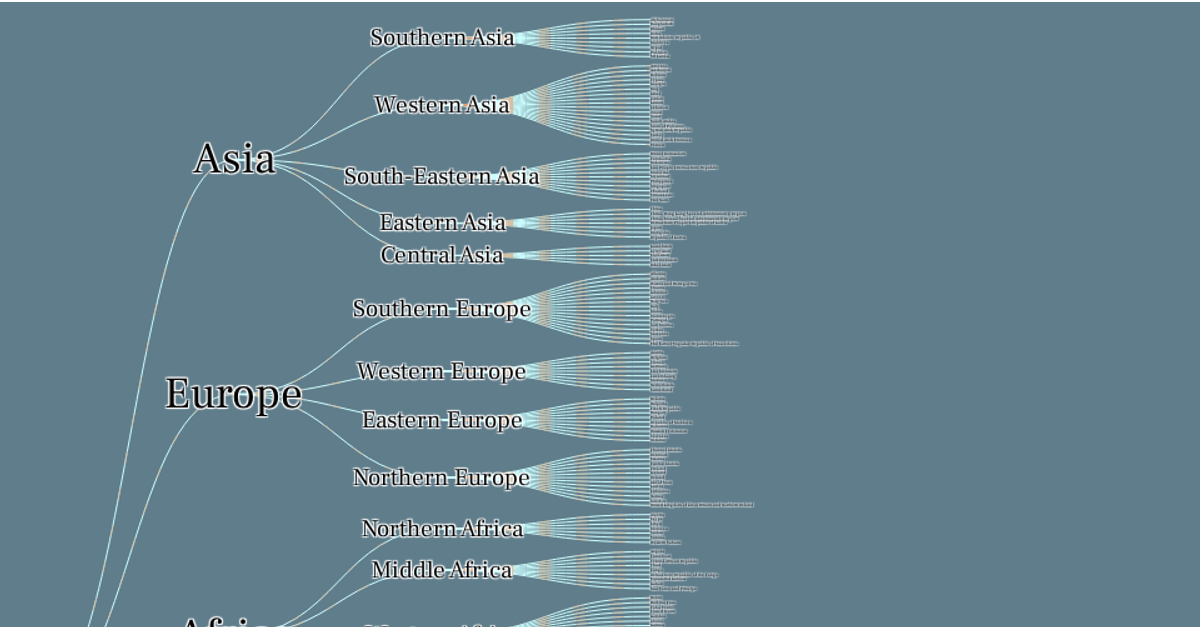
This interactive visualization presents a hierarchical tree of world countries, organized by continent and subregion, using a vertical node-link layout. The D3.js v5 code builds the tree from a JSON file, with country names displayed as text labels. Animated green dashed lines flow along the connecting paths, creating a dynamic data-flow effect against a dark blue background. The visualization employs D3’s cluster layout, hierarchy, and linkHorizontal APIs to position nodes and draw edges, with zooming enabled for exploring the full dataset.
AI-generated descriptionDataflow of World Countries Tree
MIT Licensed


Comments
Sign in to join the discussion.