🌍 Public
Re-create Marks & Channels Graphic
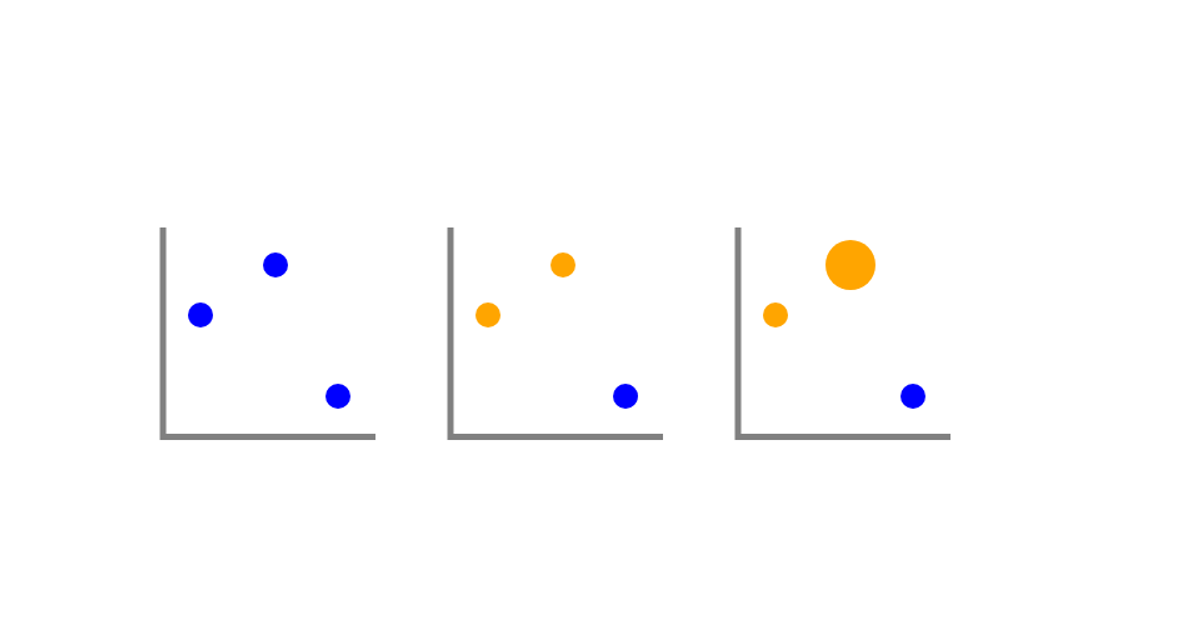
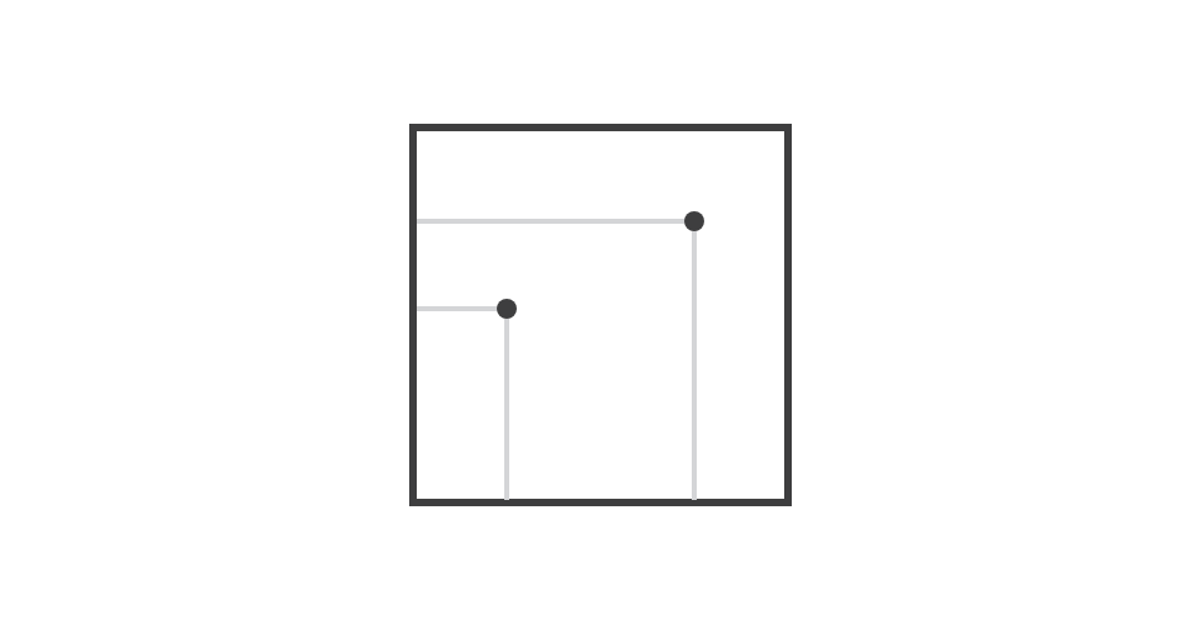
This example recreates a marks-and-channels graphic by drawing a curved line through a set of six predefined points. The path uses D3’s `line` generator with `curveCardinal` interpolation to produce a smooth spline, while small circles mark each data point. The code selects the SVG `path` and appends `circle` elements for every point, using raw coordinate arrays from the dataset. Rendering is done with D3 v5 and SVG, with the line styled via CSS as a gray, unfilled stroke.
AI-generated descriptionDemonstrates the curve using line and curve in D3.js
MIT Licensed





Comments
Sign in to join the discussion.