🌍 Public
Customizing axis
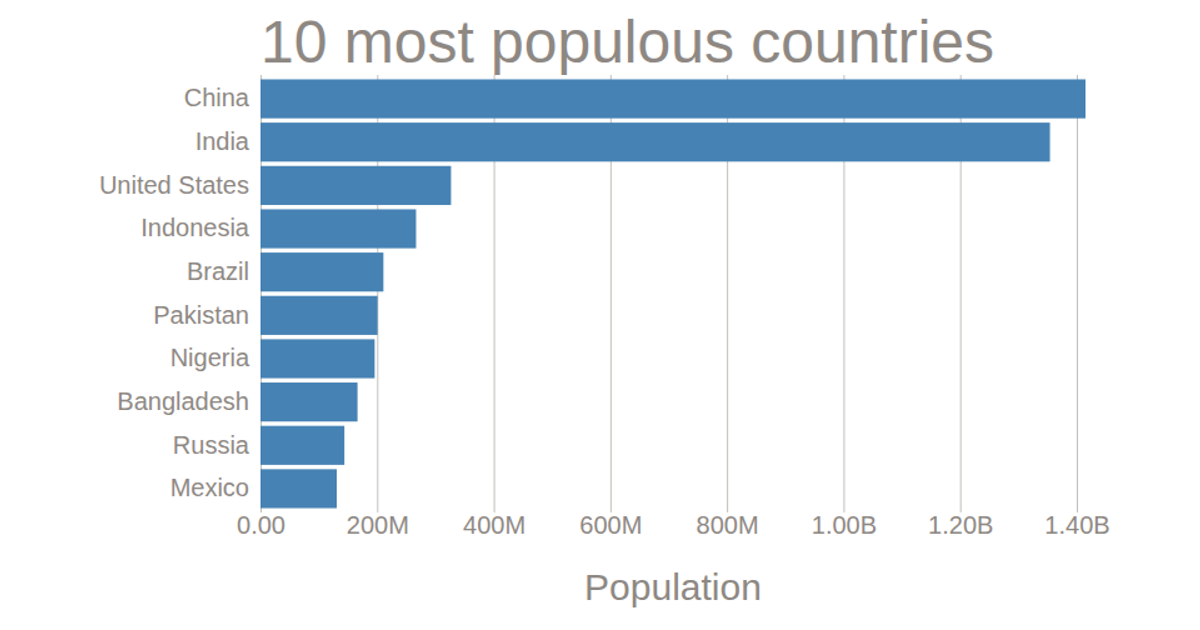
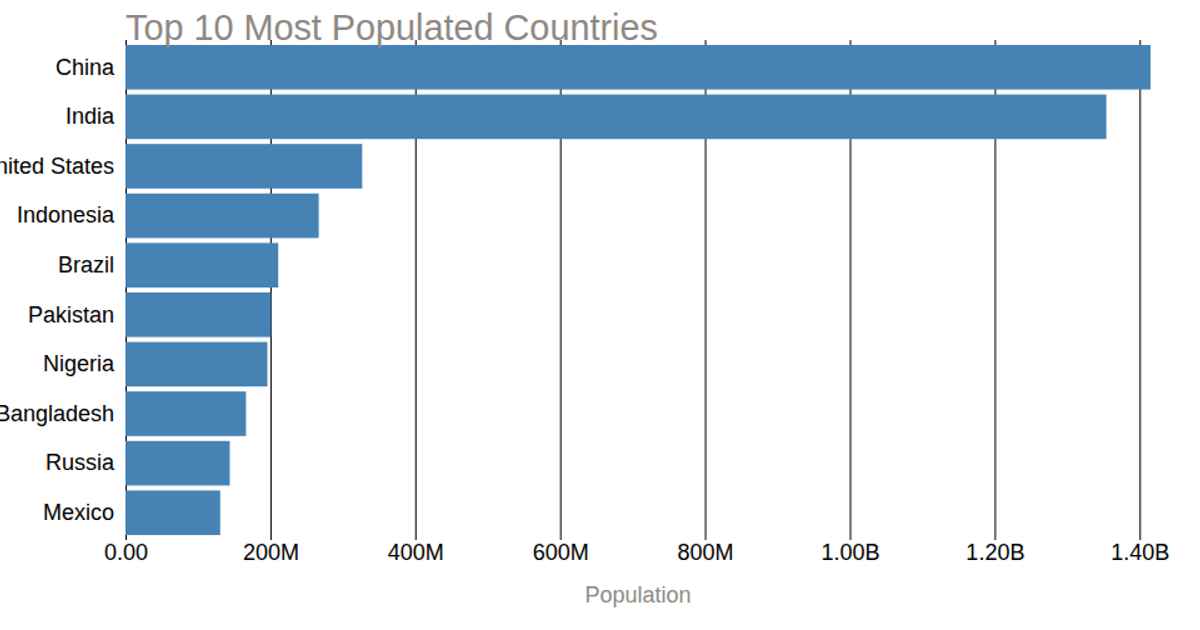
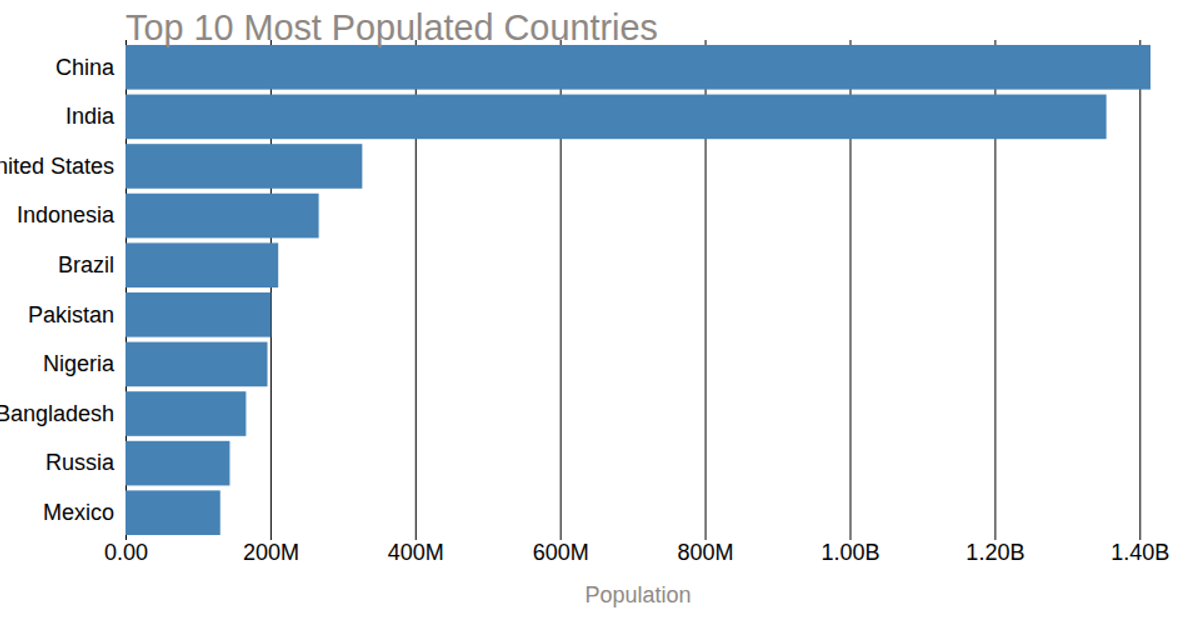
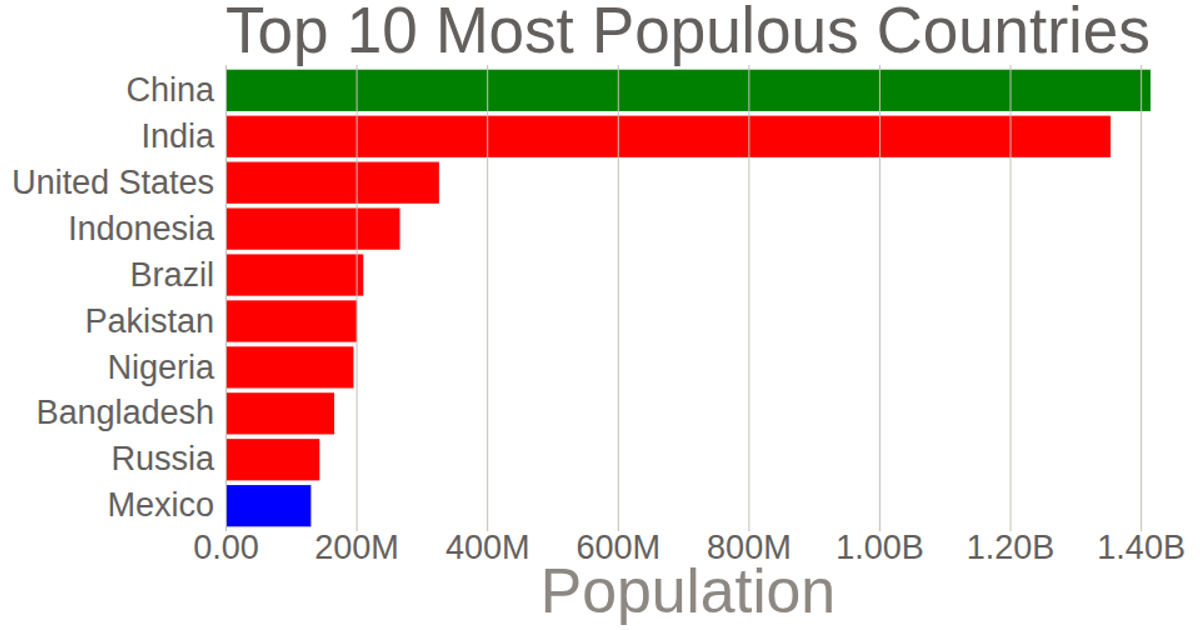
This example displays the populations of the ten most populous countries using a horizontal bar chart. The y-axis labels are customized with a distinct color and the axis lines removed, while the x-axis uses tick marks that span the chart’s height and formats values in abbreviated notation via `format('.3s')`. Data is loaded from a CSV file and processed with `csv()`, then scaled using `scaleLinear` and `scaleBand` from D3 v5. The chart is rendered as SVG elements, with axis labels and bars styled through external CSS.
AI-generated descriptionThis bar chart shows population of the top 10 most populus countries. The data come from the year 2018 estimmate in World Population by UN
MIT Licensed


Comments
Sign in to join the discussion.