🌍 Public
Ep 5 Trial
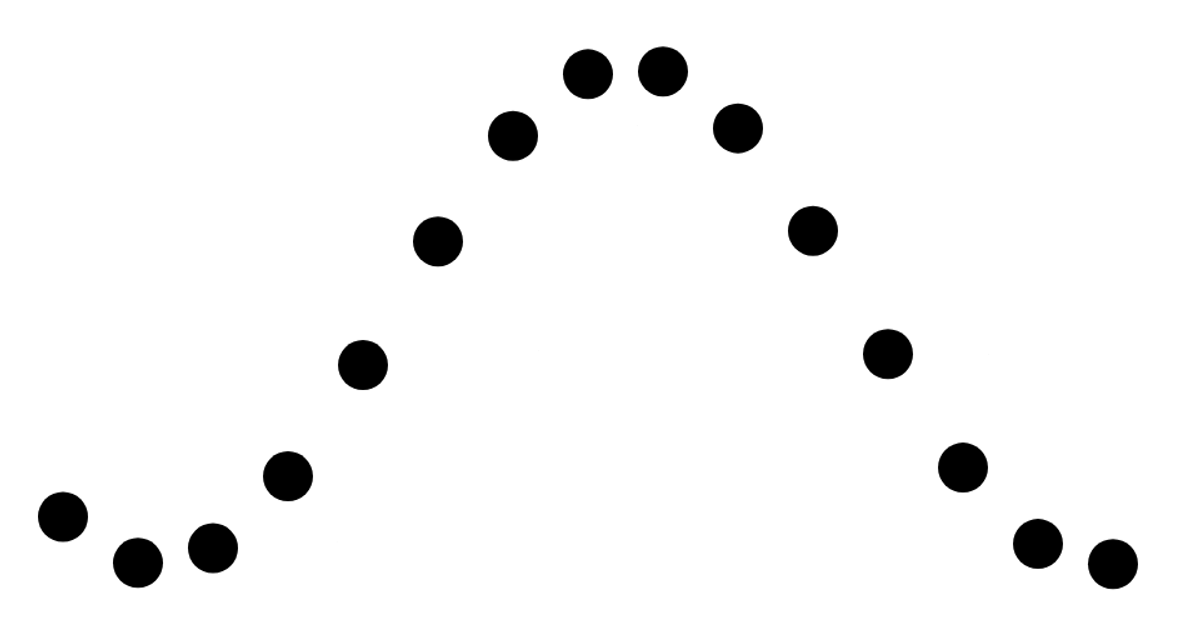
This example visualizes a dynamic field of 33 asterisk-shaped symbols that drift vertically in a sine-wave pattern across the screen. The view continuously animates as each glyph’s position and radius change over time, creating a shifting constellation effect. The visualization is built with the D3.js library (version 6.6.2), using the `select` and `selectAll` APIs to manage SVG text elements. Data is generated procedurally in `makeData.js` using D3’s `range` and `scaleLinear`, while `vizData.js` employs `symbol` and `symbolAsterisk` to render the glyphs. The animation updates at 60 frames per second via `setInterval`.
AI-generated descriptionWhat is happening here...
MIT Licensed




Comments
Sign in to join the discussion.