🌍 Public
Task - 3
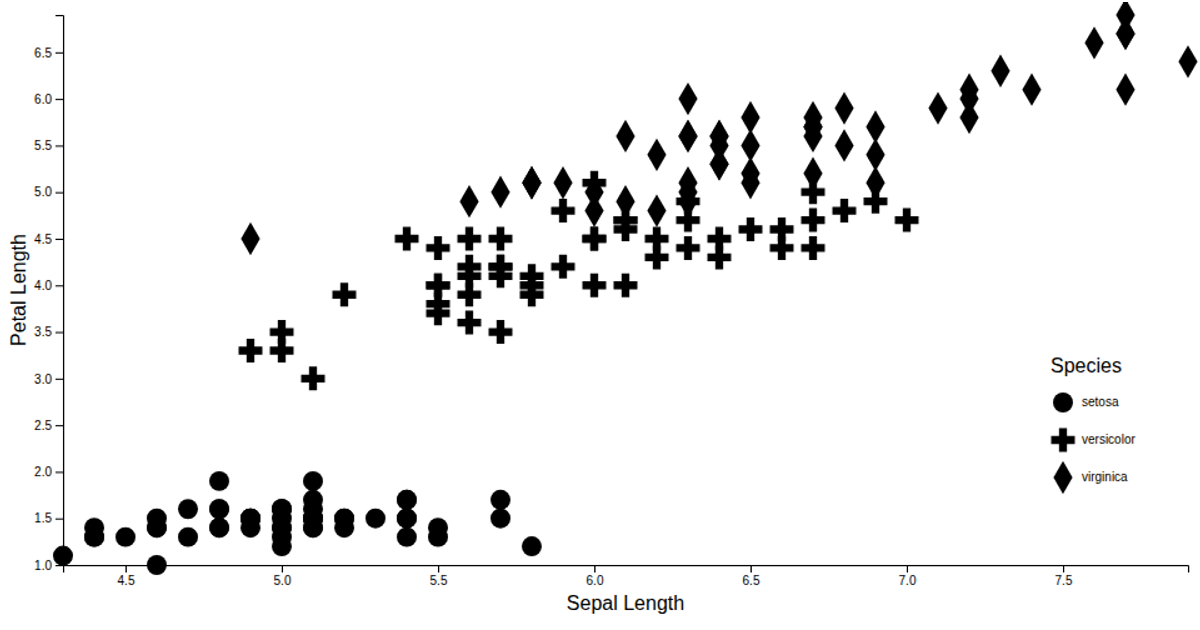
The visualization displays the Iris dataset as a scatter plot, using sepal length on the x-axis and petal length on the y-axis. Each point's shape encodes the species, with a custom legend explaining the shapes. It uses d3.scaleLinear for axes, d3.scaleOrdinal with symbolsFill for categorical shapes, and d3.axisLeft/axisBottom for axis rendering. Labels for axes and species are added via SVG text elements, with data loaded asynchronously from a CSV file.
AI-generated descriptionMIT Licensed




Comments
Sign in to join the discussion.